Wykres T i wykres Y
ObaWykresy T i Wykresy Y pomagają graficznie organizować i rejestrować pomysły, uczucia i informacje, jednocześnie identyfikując i koncentrując się na tym, co nauczyciele / uczniowie już wiedzą, rozumieją, cenią i potrafią zrobić. Umożliwia to uczniom / nauczycielom porównywanie i kontrastowanie pomysłów, uczuć i informacji w różnych kontekstach.
Czym jest wykres Y
Wykres T to graficzny organizer, który bada dwa aspekty tematu, takie jak zalety i wady związane z nim, jego plusy i minusy, fakty vs. opinie itp. Wypisując tematy jako nagłówki dla 2 kolumn i zapisując kilka aspektów, które są ważne dla obu opcji, łatwo jest dokonać porównania. W jednej formie może to być lista pozytywnych i negatywnych cech związanych z danym wyborem, co zapewnia uwzględnienie zarówno pozytywnych, jak i negatywnych aspektów każdej decyzji. Po zakończeniu przeglądu zobaczysz, że możesz znaleźć rozwiązanie swojego problemu. I to jest ważne, aby podjąć ostateczną decyzję.
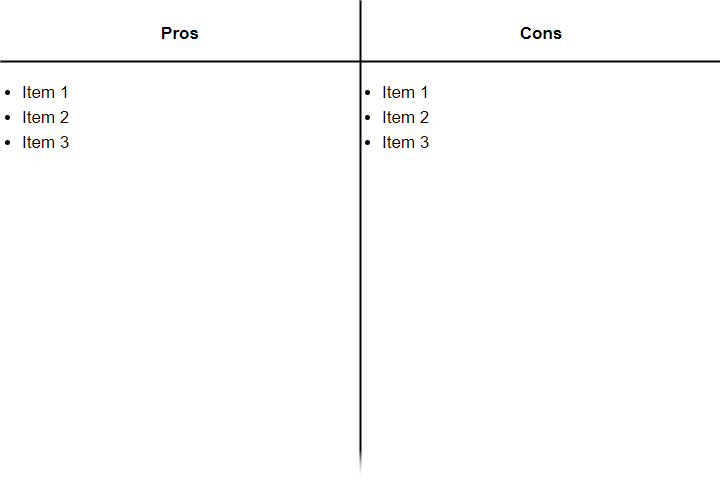
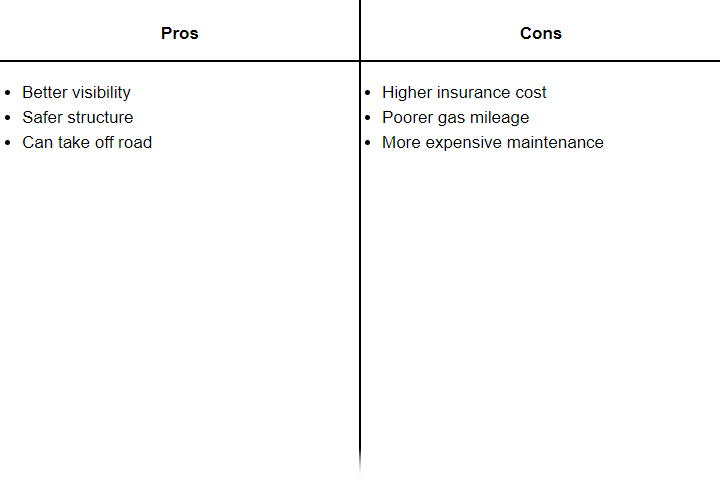
Przykład: jakie są zalety i wady decyzji o zakupie pojazdu sportowo-użytkowego?
Kiedy używać wykresu T?
Na przykład uczeń może użyć wykresu T, aby graficznie zorganizować myśli na temat:
- Zarejestruj informacje o dowolnych dwóch cechach tematu
- Ocena zalet i wad tematu
- Podejmowanie decyzji poprzez porównanie wynikających zalet i wad
- Wypisywanie faktów vs. opinii na temat
- Wymienianie problemów i rozwiązań związanych z działaniem
- Wyjaśnianie mocnych i słabych stron tematu
Czym jest wykres Y?
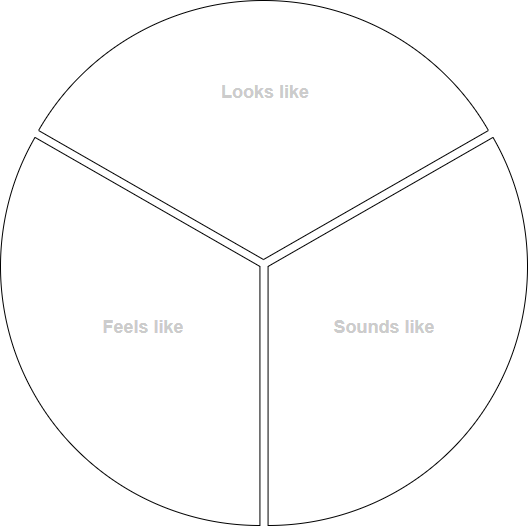
Wykres Y to trójczęściowy graficzny organizer, który organizuje burzę mózgów na temat wokół trzech wymiarów:
- Jak to wygląda?
- Jak to się czuje?
- Jak to brzmi?
Tradycyjnie nauczyciele używają wykresu Y jako skutecznego narzędzia w klasie od wielu lat. Służy jako narzędzie analityczne, ponieważ uczniowie i nauczyciele dążą do odkrywania coraz więcej na temat danego tematu, korzystając z podejścia zmysłowego, co ten temat wygląda, brzmi i czuje.
Wykres T jest zazwyczaj uzupełniany jako etap wstępny lub ćwiczenie burzy mózgów, z którego można zacząć tworzyć produkt, taki jak raport pisemny, mapy myśli, prezentacje PowerPoint i wywiady. Proces ten zachęca uczestników do bycia krytycznymi myślicielami i identyfikowania odpowiednich zachowań w celu osiągnięcia tego.
Kroki do stworzenia wykresu Y?
- Zdecyduj o temacie/umiejętności społecznej, którą chcesz zbadać z uczniami
- Zorganizuj uczniów w małe grupy, przydzielając zadania każdemu członkowi grupy, takie jak notujący, reporter, czasomierz, organizator
- Członkowie zespołu tworzą wykres Y z nagłówkami Wygląda jak, brzmi jak i czuje jak w każdej trzeciej części wykresu
- Niech zespół wymyśli jak najwięcej możliwości w określonym czasie
- Każda grupa składa raport
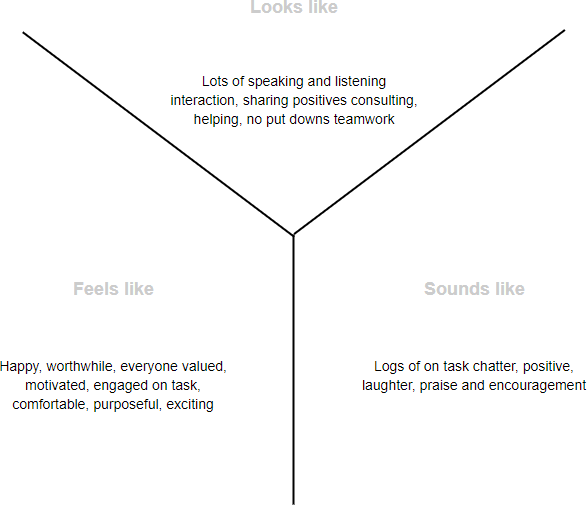
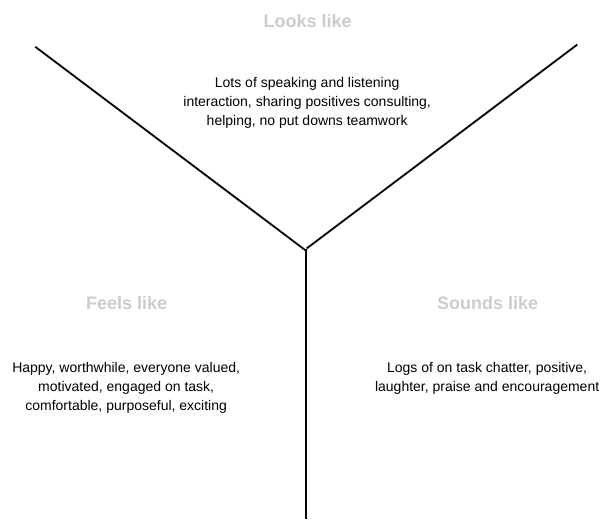
Przykład — jak wygląda, jak się czuje i jak brzmi spotkanie formujące zespół.
Szablony wykresu T
Ten post dostępny jest również w Deutsch, English, Español, فارسی, Français, Bahasa Indonesia, 日本語, Portuguese, Ру́сский, Việt Nam, 简体中文 and 繁體中文


