What has proven to be the strength of Scrum the past 20 years? What should be the focus of Scrum the upcoming 20 years? What of Scrum frustrated you the most so far? What connects you to Scrum? What is a small improvement that could be added to Scrum?
Continue readingTag: tw-done
Automated Tool — Do-it-Yourself Project Manager
Businesses, large and small, unquestionably juggle numerous projects, plans, tasks and people. The primary purpose of project management software is to help managers plan, execute and control all aspects of the project management process (such as PMBOK or PRINCE2). Visual Paradigm helps your team to kick-start any size of IT projects with automated guide-through process, with step-by-step instruction, input references and samples.
Continue readingThe Best Online Flowchart Software 2019
The flowchart is only a graphical representation of the steps. It displays steps in a sequential manner and is widely used to display algorithm flow, workflow or process. It is a diagram that uses different symbols to represent a process. These symbols contain information about steps or sequence of events. Each symbol is connected with an arrow to indicate the process direction of the process.
Continue readingAgile User Story Mapping Tool
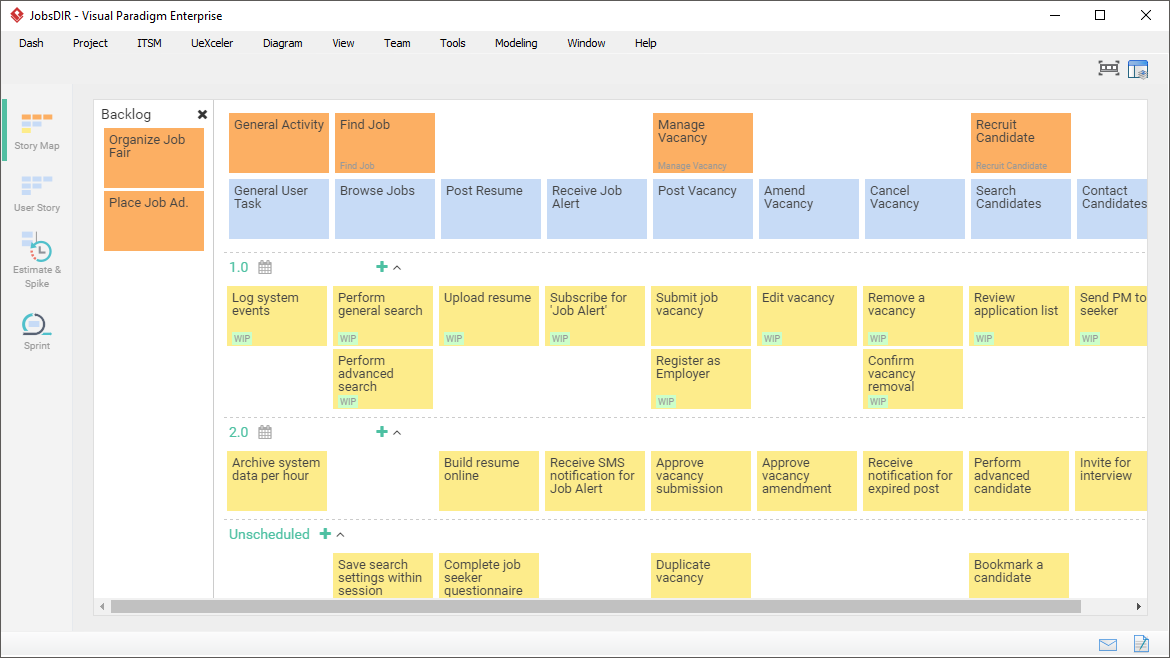
User Story Maps provide Scrum teams with a visual and structured approach to managing product backlogs. The visual story map enables the effective arrangement of product backbones (user activities), user tasks, epics and user stories into a manageable top-down structure based on the nature, priority and complexity of the map items.
Continue readingValue Stream Mapping Tutorial
Looking for a VSM software? Our value stream mapping software makes creating professional value stream mapping easy and fast. The value stream mapping tool comes with a rich set of value stream mapping symbols. Combined with a drag-and-drop VSM editor and a powerful feature set, you can easily create professional value stream mapping.
Continue readingFishbone Diagram — How to Draw?
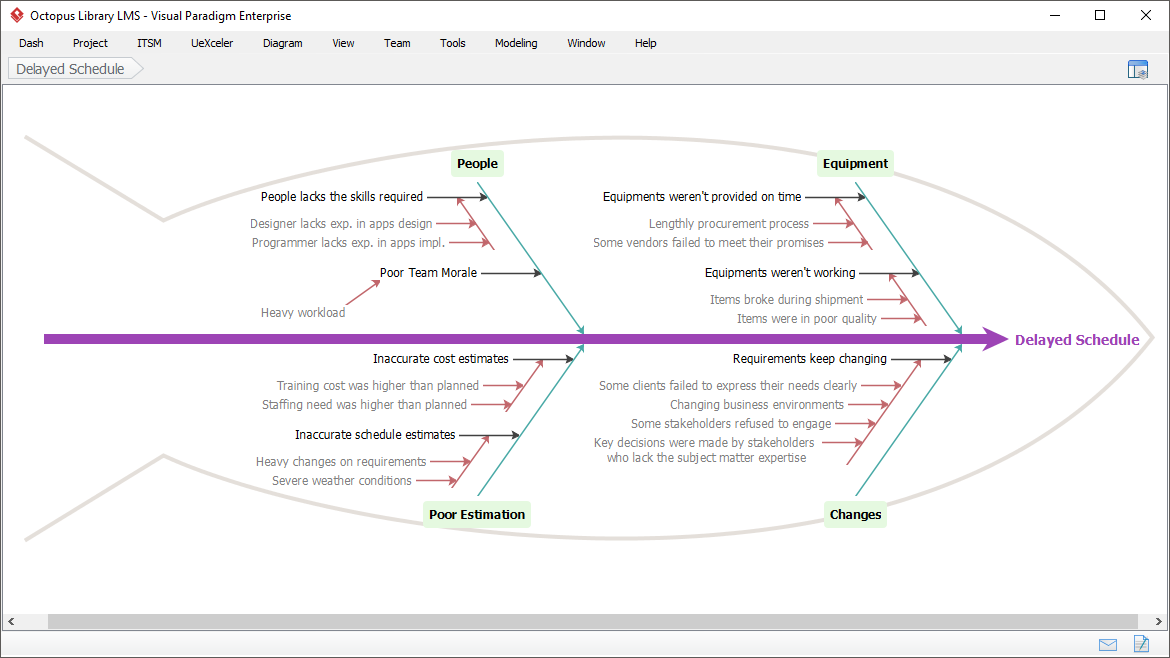
A fishbone diagram (also known as a cause and effect diagram or Ishikawa diagram) visually shows multiple causes of a problem. It helps identify stakeholder ideas about the cause of an issue and allows users to immediately categorize ideas into themes for analysis or further data collection. It can be used in conjunction with the „Five Whys” technique.
Continue readingUse Case — Learn By Examples
A use case describes how a user uses a system to accomplish a specific goal. A use case diagram consists of a system, related use cases, and actors, and relates them to each other in order to visualize: what is being described? (the system), who is using the system? (actor) and what the actor wants to achieve? (use case), so that use cases help ensure that the right system is developed by capturing the requirements from the user’s perspective.
Continue readingBPMN —Quick Guide
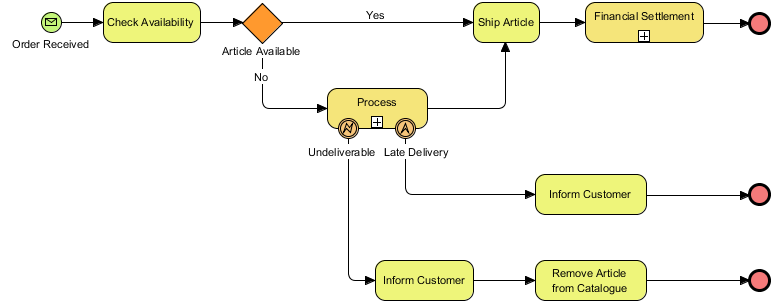
The Business Process Management Initiative (BPMI) has developed a standard Business Process Modeling Notation (BPMN). The BPMN 1.0 specification was released to the public in May 2004. The specification represents more than two years of work by the BPMI Notation Working Group. In February 2006, the OMG released a BPMN specification document. Version 2.0 of BPMN was developed in 2010 and the actual version of the specification was released in December 2013.
Continue readingWhat is Project Initiation Document (PID)? Using Why-What-How-When-Who Template
The project imitation document defines the project scope, management, and overall success criteria that the team can look back on during the project. It contains basic information about the project, such as context, scope, team and collaboration. It is equally important as an internal guide and an external stakeholder
Continue readingProject Management — Communication Plan Template and Example
A communication plan is a policy-driven approach to providing information to stakeholders. The plan formally defines who should receive specific information, when that information should be provided, and what communication channels will be used to provide the information.
Continue reading