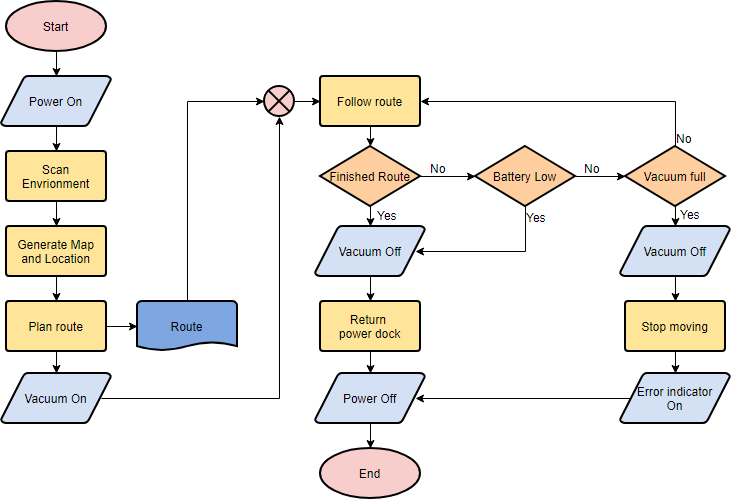
(Kliknij i edytuj powyższy diagram natychmiast) (Kliknij i Utwórz nowy diagram)
Diagram to po prostu graficzna reprezentacja kroków. Pokazuje kroki w kolejności sekwencyjnej i jest szeroko stosowany do przedstawiania przepływu algorytmów, przepływu pracy lub procesów. Jest to rodzaj diagramu reprezentującego proces przy użyciu różnych symboli zawierających informacje o krokach lub sekwencji zdarzeń. Każdy z tych symboli jest połączony strzałkami, aby zilustrować kierunek przepływu procesu.
Diagramy powstały w informatyce jako narzędzie do reprezentowania algorytmów i logiki programowania, ale rozszerzyły się na użycie w innych rodzajach procesów. Obecnie diagramy odgrywają niezwykle ważną rolę w wyświetlaniu informacji i wspomaganiu rozumowania.
Celem diagramu jest dostarczenie ludziom wspólnego języka lub punktu odniesienia podczas pracy nad projektem lub procesem. Pomaga nam wizualizować złożone procesy lub wyraźnie określić strukturę problemów i zadań. Diagram może być również używany do zdefiniowania procesu lub projektu do wdrożenia.
Symbole diagramów
Różne kształty diagramów mają różne konwencjonalne znaczenia. Znaczenia niektórych z bardziej powszechnych kształtów są następujące:
Terminatory
Symbol terminatora reprezentuje punkt początkowy lub końcowy systemu.

Proces
Prostokąt wskazuje na jakąś szczególną operację.

Dokument
Reprezentuje to wydruk, taki jak dokument lub raport.

Decyzja
Diament reprezentuje decyzję lub punkt rozgałęzienia. Linie wychodzące z diamentu wskazują różne możliwe sytuacje, prowadzące do różnych podprocesów.

Dane
Reprezentuje to informacje wchodzące lub wychodzące z systemu. Wejściem może być zamówienie od klienta. Wyjściem może być produkt do dostarczenia.

Odniesienie na stronie
Ten symbol zawierałby literę w środku. Wskazuje, że przepływ kontynuuje na odpowiadającym symbolu zawierającym tę samą literę gdzie indziej na tej samej stronie.

Odniesienie poza stroną
Ten symbol zawierałby literę w środku. Wskazuje, że przepływ kontynuuje na odpowiadającym symbolu zawierającym tę samą literę gdzie indziej na innej stronie.

Opóźnienie lub wąskie gardło
Identyfikuje opóźnienie lub wąskie gardło.

Przepływ
Linie reprezentują przepływ sekwencji i kierunek procesu.

Przykłady diagramów
Oto kilka przykładów diagramów. Zobacz, jak możesz praktycznie zastosować diagram.
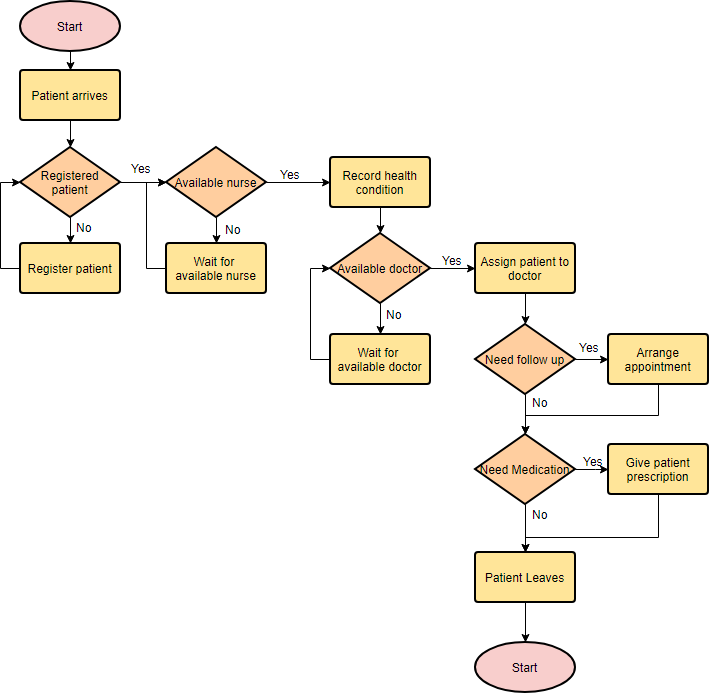
Przykład diagramu — Usługa medyczna
To jest przykład diagramu szpitalnego, który pokazuje, jak powinny być przetwarzane przypadki kliniczne. Ten diagram intensywnie wykorzystuje kształty decyzji do reprezentowania alternatywnych przepływów.
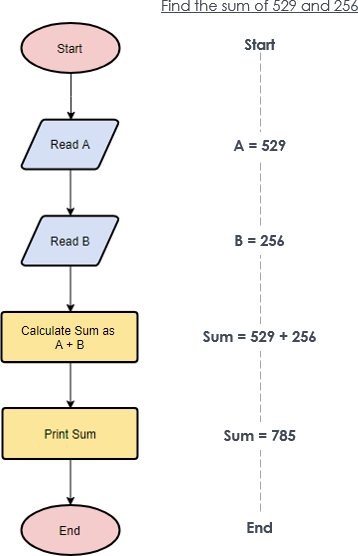
Przykład diagramu — Proste algorytmy
Diagram może być również używany do wizualizacji algorytmów, niezależnie od ich złożoności. Oto przykład, który pokazuje, jak diagram może być używany do przedstawienia prostego procesu sumowania.
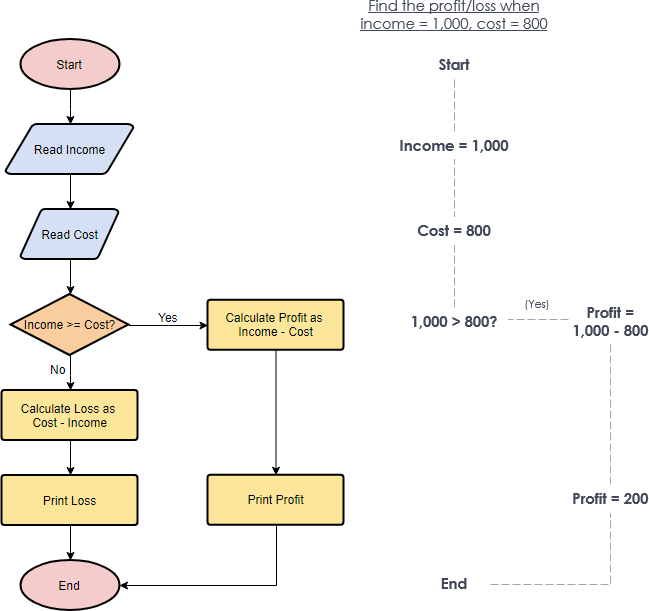
Przykład diagramu — Obliczanie zysku i straty
Przykład diagramu poniżej pokazuje, jak można obliczyć zysk i stratę.
Tworzenie diagramu w Visual Paradigm
Zobaczmy, jak narysować diagram w Visual Paradigm. Użyjemy tutaj bardzo prostego przykładu diagramu. Możesz rozszerzyć przykład po zakończeniu tego samouczka.
- Wybierz Diagram > Nowy z głównego menu.
- W oknie Nowy diagram wybierz Diagram i kliknij Dalej.
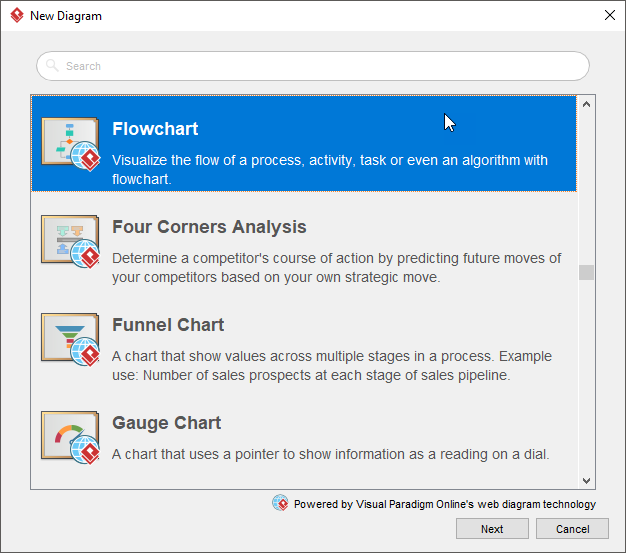
3. Możesz zacząć od pustego diagramu lub od szablonu diagramu lub dostarczonego przykładu diagramu. Zacznijmy od pustego diagramu. Wybierz Pusty i kliknij Dalej.
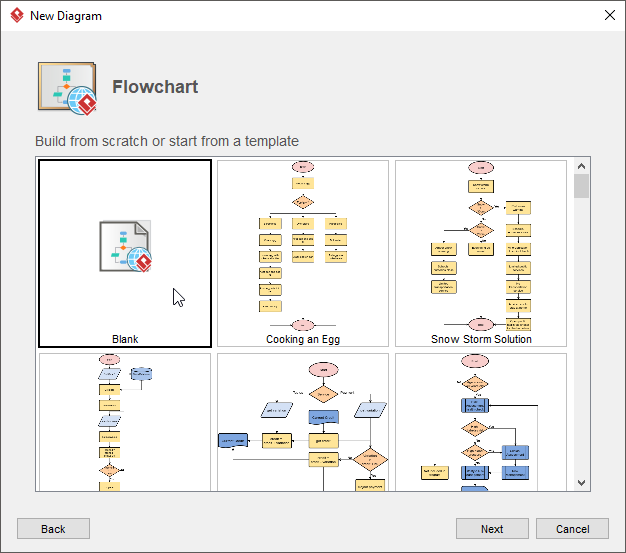
4. Wprowadź nazwę diagramu i kliknij OK.
5. Zacznijmy od utworzenia symbolu Start. Przeciągnij kształt Start z paska narzędzi diagramu i upuść go na diagram. Nazwij go Start.
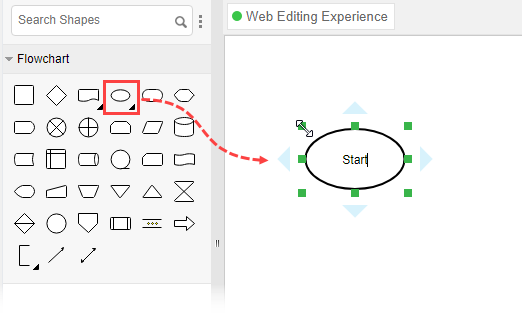
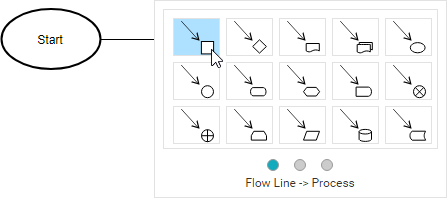
6. Utwórz następny kształt. Przesuń wskaźnik myszy nad kształt początkowy. Naciśnij na trójkątny uchwyt po prawej stronie i przeciągnij go na zewnątrz.
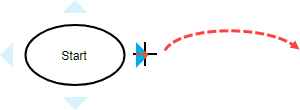
7. Zwolnij przycisk myszy. Wybierz Linię przepływu > Proces z Katalogu zasobów.
8. Wprowadź Dodaj przedmioty do koszyka jako nazwę procesu.
9. Wykonaj te same kroki, aby utworzyć dwa dodatkowe procesy Zamówienie koszyka zakupowego i Ureguluj płatność.

10. Zakończ przepływ, tworząc terminator.
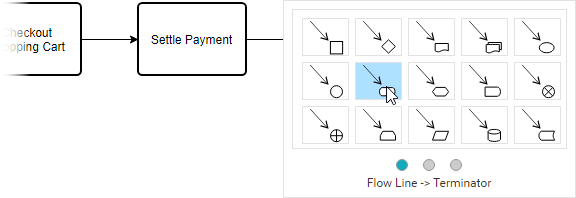
Twój diagram powinien wyglądać tak:

11. Pokoloruj kształty. Wybierz Diagram > Panel formatowania z głównego menu. Wybierz kształt na diagramie i kliknij, aby zaktualizować jego kolor w ustawieniach stylu w Panelu formatowania.
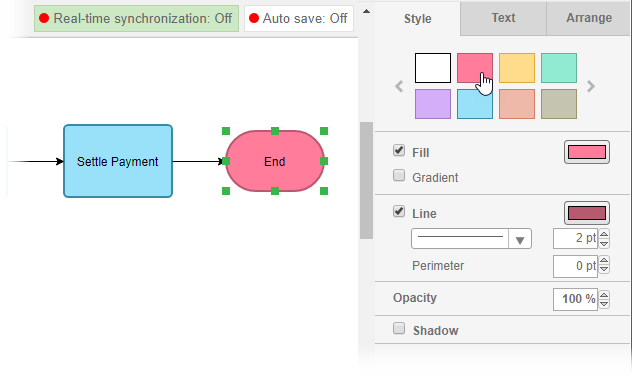
To jest ostateczny diagram przepływu:

Ten post dostępny jest również w Deutsch, English, Español, فارسی, Français, Bahasa Indonesia, 日本語, Portuguese, Ру́сский, Việt Nam, 简体中文 and 繁體中文


