Przygotuj swoje wizualizacje (diagramy, wykresy, infografiki, mapy procesów, obrazy…) szybciej i łatwiej z Visual Paradigm Online!
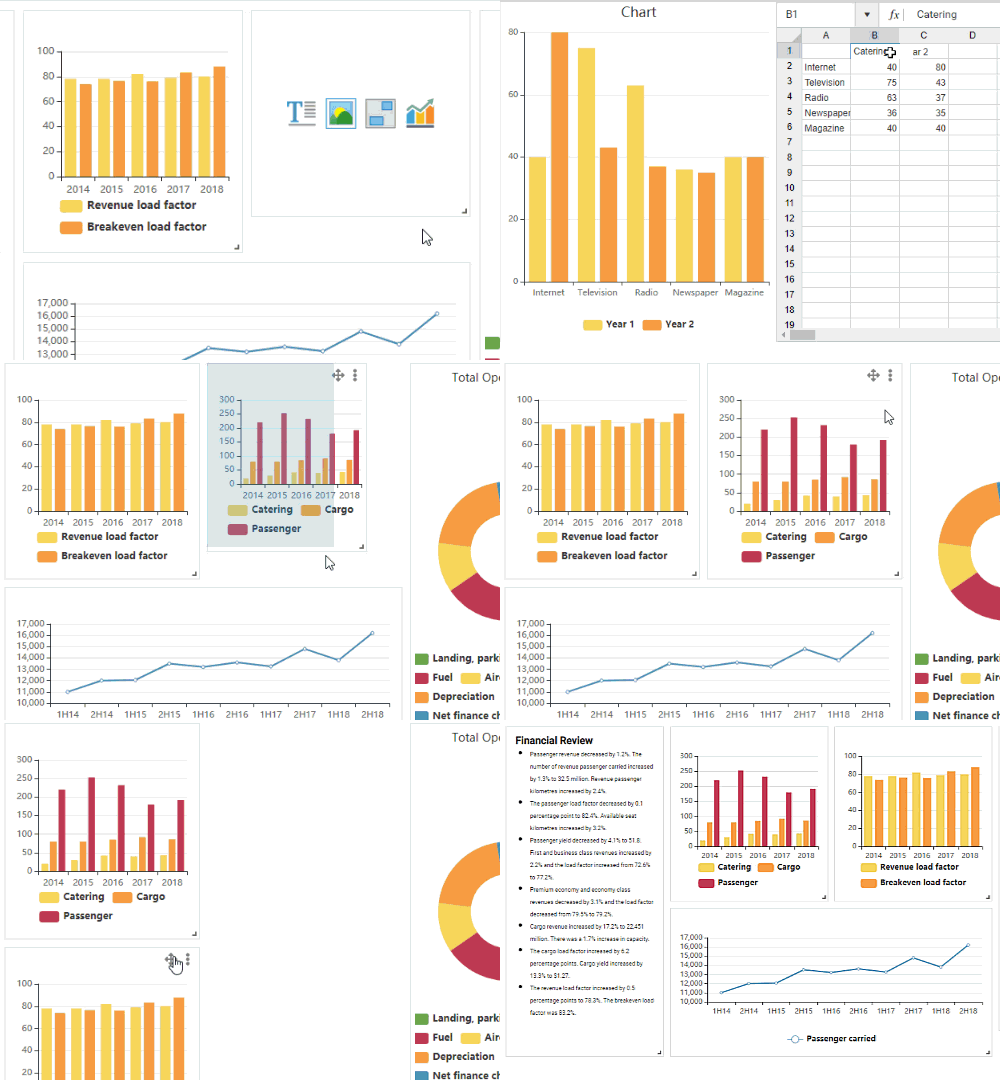
Możesz wprowadzić swoje dane za pomocą dołączonego arkusza kalkulacyjnego lub skopiować i wkleić z Excela i Google Docs.
Możesz ładnie je ułożyć za pomocą konfigurowalnego pulpitu nawigacyjnego z funkcją przeciągnij i upuść
- Setki wykresów i wizualizacji do uwzględnienia
- Intuicyjny edytor przypominający arkusz kalkulacyjny do edytowania danych wykresu
Inteligentny pulpit nawigacyjny
Wizualizuj dane w cenne spostrzeżenia. Twórz pulpity nawigacyjne i przeprowadzaj analizy ad-hoc zaledwie kilkoma kliknięciami.
- Przeciągnij i upuść, aby zmienić rozmiar i przenieść komponenty
- Automatycznie skalowany i dopasowywany komponent pulpitu nawigacyjnego
- Setki wykresów i wizualizacji do uwzględnienia
- Intuicyjny edytor przypominający arkusz kalkulacyjny do edytowania danych wykresu
- Podział treści na wiele stron

Projektant map procesów
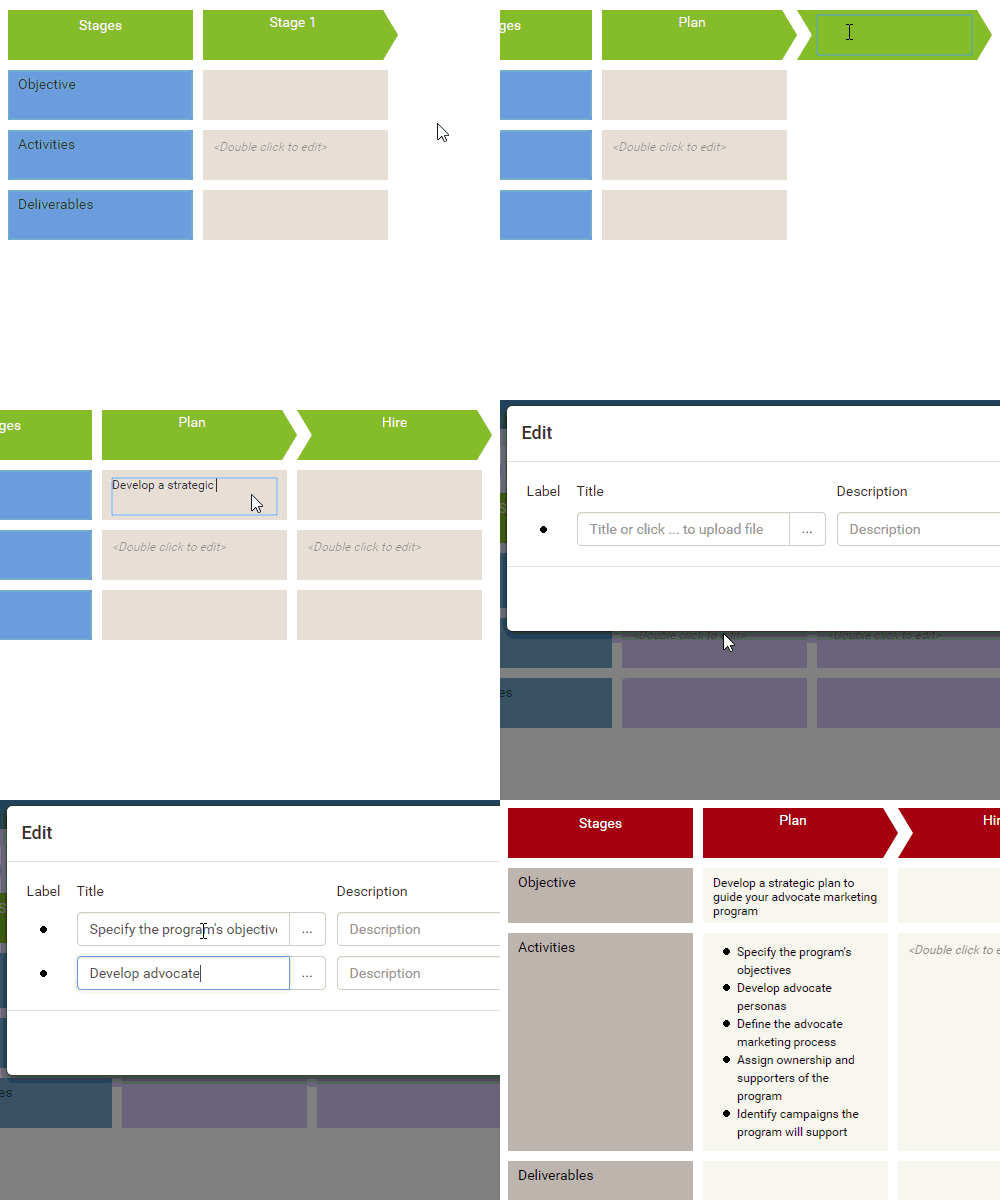
Potężny edytor map procesów zaprojektowany w celu wsparcia szerokiego zakresu potrzeb w zakresie mapowania procesów.
- Mapowanie procesów biznesowych
- Definicja ram
- Tworzenie mapy drogowej
- Tworzenie harmonogramu i rozkładu zajęć
- Jako narzędzie analityczne (np. tabela porównawcza produktów)
- Mapa podróży klienta

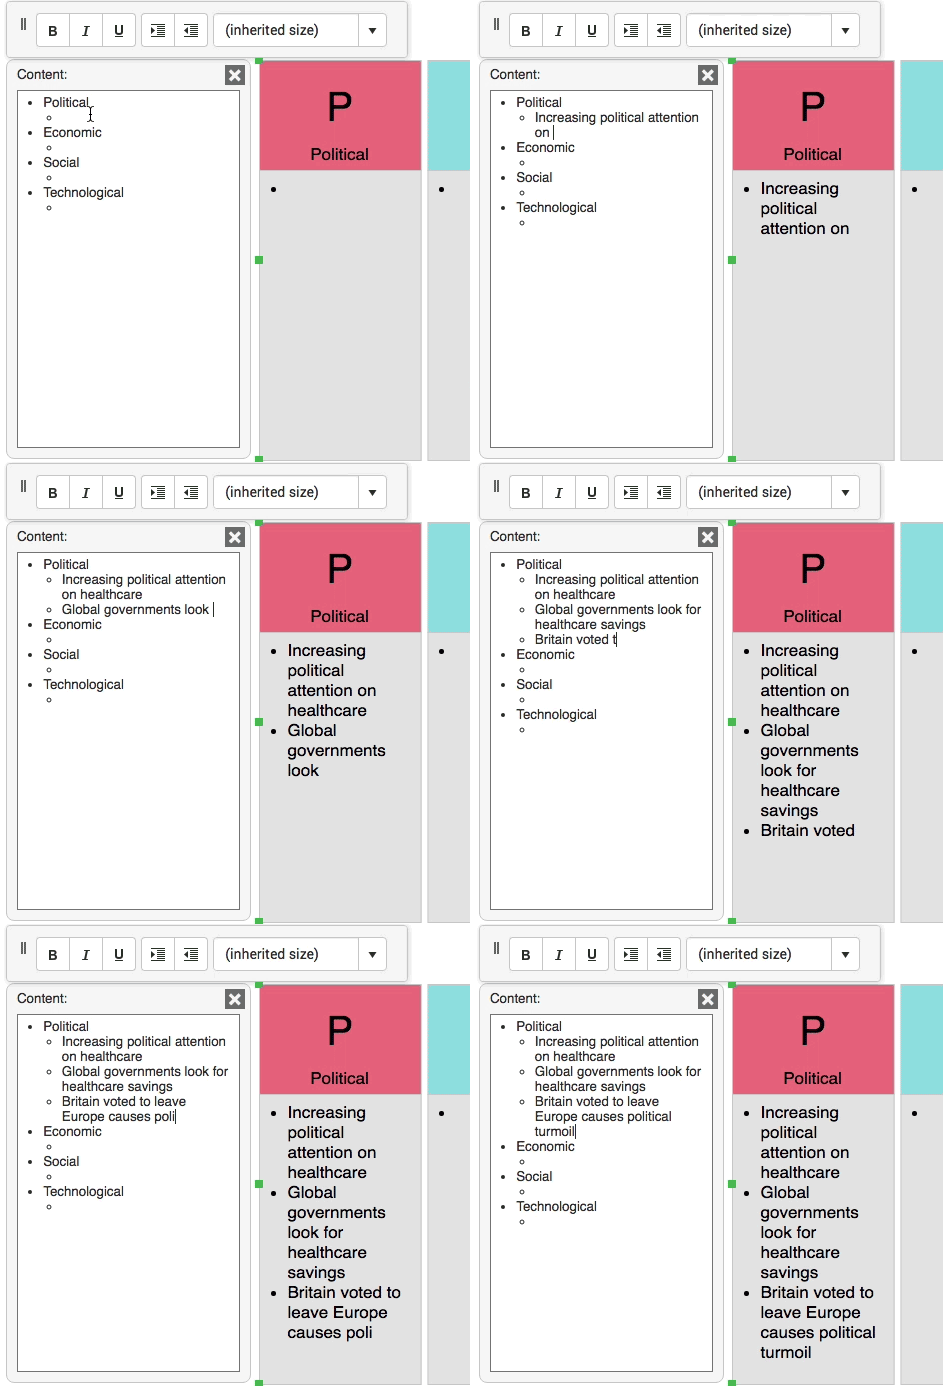
Przekształć punkty wypunktowane w skalowalne wizualizacje. Automatycznie.
Kształt InfoArt przekształca zwykłą listę elementów w coś wizualnie atrakcyjnego. W miarę wpisywania na liście diagram jest tworzony z elementów i ciągle aktualizowany z komponentami oraz automatycznie pozycjonowanym tekstem.
Dzięki InfoArt możesz spędzać czas na analizowaniu, a nie rysowaniu, jednocześnie zachowując profesjonalny i piękny efekt.

Chcesz dowiedzieć się więcej o tym, jak tworzyć te wizualizacje?
(odwiedź tutaj, aby uzyskać więcej szczegółów)
Ten post dostępny jest również w Deutsch, English, Español, فارسی, Français, Bahasa Indonesia, 日本語, Portuguese, Ру́сский, Việt Nam, 简体中文 and 繁體中文


