Diagram interakcji diagram interakcjijest wizualnym przedstawieniem, które mapuje powiązania przyczynowo-skutkowe wśród złożonych, wielowymiarowych problemów lub pożądanych wyników. Dzięki powiązanym połączeniom możesz lepiej analizować relacje przyczynowo-skutkowe, które istnieją wśród wszystkich czynników złożonej sytuacji, co ostatecznie pozwala na opracowanie skutecznego rozwiązania problemu. Możesz logicznie połączyć więcej niż jeden czynnik jednocześnie. Proces ten zachęca do myślenia w wielu kierunkach, zamiast myślenia liniowego. Gdy wszystkie istotne połączenia między elementami zostaną narysowane, połączenia są liczone. Te z największą liczbą połączeń będą zazwyczaj najważniejszymi czynnikami, na których należy się skupić.
Kiedy używać diagramu interakcji?
- Zachęca członków zespołu do myślenia w wielu kierunkach, a nie liniowo
- Bada relacje przyczynowo-skutkowe wśród wszystkich problemów, w tym najbardziej kontrowersyjnych
- Pozwala kluczowym kwestiom pojawić się naturalnie, a nie być wymuszanym przez dominującego lub wpływowego członka zespołu
- Systematycznie ujawnia podstawowe założenia i powody nieporozumień wśród członków zespołu
- Pozwala zespołowi zidentyfikować przyczyny źródłowe, nawet gdy wiarygodne dane nie istnieją
Kroki do stworzenia diagramu interakcji
Aby stworzyć diagram interakcji, ważne jest, aby napisać stwierdzenie, które definiuje problem, który ma być badany. Członkowie zespołu muszą burzę mózgów i zapisać pomysły wokół głównych kwestii. Gdy pomysły zostaną umieszczone na problemie, należy połączyć je za pomocą strzałek, aby ustalić ich relację.
Aby stworzyć diagram interakcji:
- Zidentyfikuj problem lub pytanie.
- Dodaj problemy / wpływy / przyczyny problemu
- Porównaj każdy element z innymi. Użyj strzałki „wpływu”, aby połączyć powiązane elementy.
- Strzałki powinny być rysowane z elementu, który wpływa na ten, który jest wpływany.
- Jeśli dwa elementy wpływają na siebie nawzajem, strzałka powinna być narysowana, aby odzwierciedlić silniejszy wpływ.
- Policz strzałki.
- Elementy z największą liczbą wychodzących strzałek będą przyczynami źródłowymi lub czynnikami napędowymi.
- Te z największą liczbą przychodzących strzałek będą kluczowymi wynikami lub rezultatami.
Przykład diagramu interakcji — Długi czas oczekiwania na autobusy
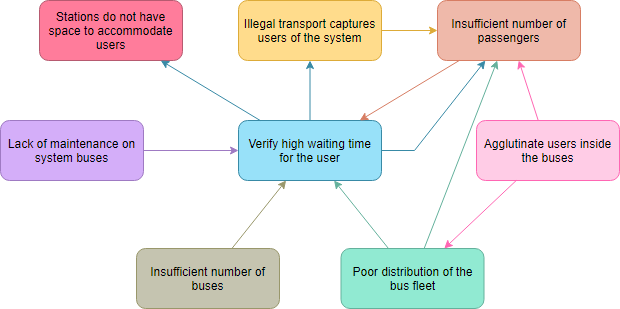
*Źródło: whatissixsigma.net
Analizuj diagram
- Policz liczbę strzałek wejściowych i wyjściowych (wejście/wyjście) na każdej karcie i oznacz to w jednym z jej rogów.
- Jeśli element powoduje wiele innych: to są główne przyczyny.
- Jeśli element jest dotykany przez wiele strzałek: reprezentuje ostateczne efekty.
- Te elementy, które koncentrują wiele przychodzących i wychodzących strzałek: to kluczowe elementy.
Przykład diagramu interakcji — Słaba komunikacja w wysyłce produktów
Ten przykład pochodzi z *Benbow i Kubiak w 2005 roku). Teraz zinterpretujmy znaczenie diagramu, więc jakie są kluczowe czynniki lub przyczyny do zbadania i poprawy?
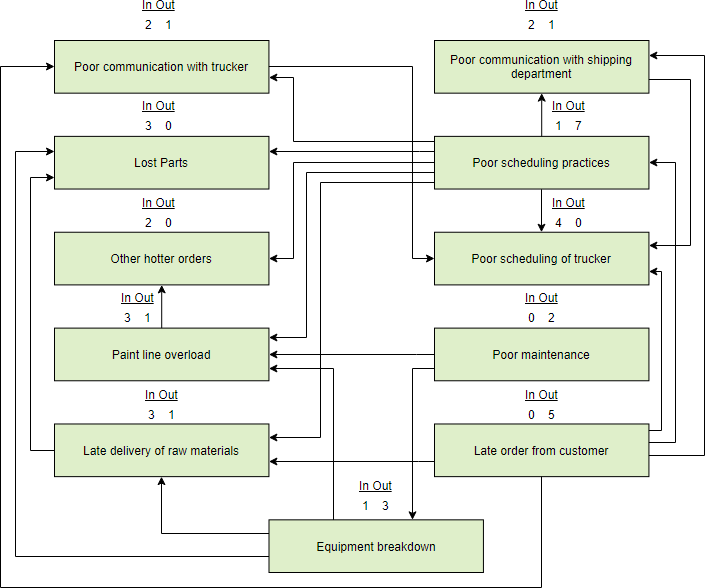
Przypomnij, że:
Zidentyfikuj kluczową przyczynę (czynnik napędowy)
Nazwaliśmy wpisy w digrafie kwestiami.Kwestia z dużą liczbą wychodzących strzałek jest czynnikiem napędowym lub kluczową przyczyną. Kluczowa przyczyna wpływa na dużą liczbę innych elementów. Powyższy diagram pokazuje następujące kluczowe przyczyny:
- ‚Słabe praktyki planowania’ (6 wychodzących strzałek),
- ‚Opóźnione zamówienie od klienta’ (5 wychodzących strzałek), i
- ‘Awaria sprzętu (3 wychodzące strzałki).
Zidentyfikuj Kluczowy Problem
- Problem z dużą liczbą strzałek wejściowych jest dotknięty przez dużą liczbę innych problemów. Może więc być źródłem wskaźnika jakości lub wydajności.
- ‘Złe planowanie kierowcy’ ma 4 strzałki wejściowe.
- Wskaźnik złej wydajności planowania kierowcy może wskazywać na wielkość problemów systemowych powodujących opóźnioną dostawę.
- Benbow, D. W. i T. M. Kubiak — Podręcznik Certyfikowanego Czarnym Paskiem Six Sigma. Milwaukee, Wisconsin, ASQ Quality Press w 2005 roku.
Przykłady:
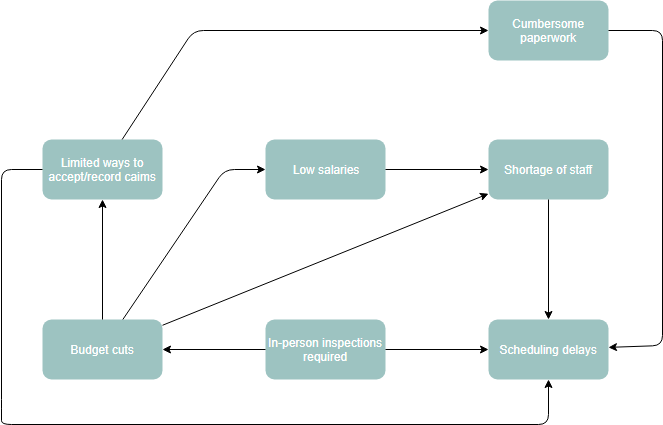
Przykład diagramu interakcji — Program zmiany w firmie
Poniżej znajduje się przykład diagramu interakcji który został stworzony, aby pomóc zespołowi zidentyfikować, dlaczego inicjatywa zmiany w organizacji nie przyniosła oczekiwanych korzyści. Opcjonalnie, diagram może umieścić sumy strzałek przychodzących i wychodzących na górze każdego elementu.
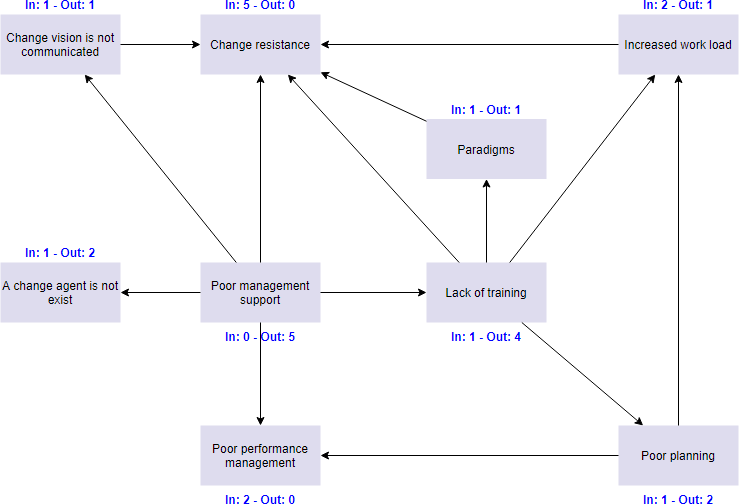
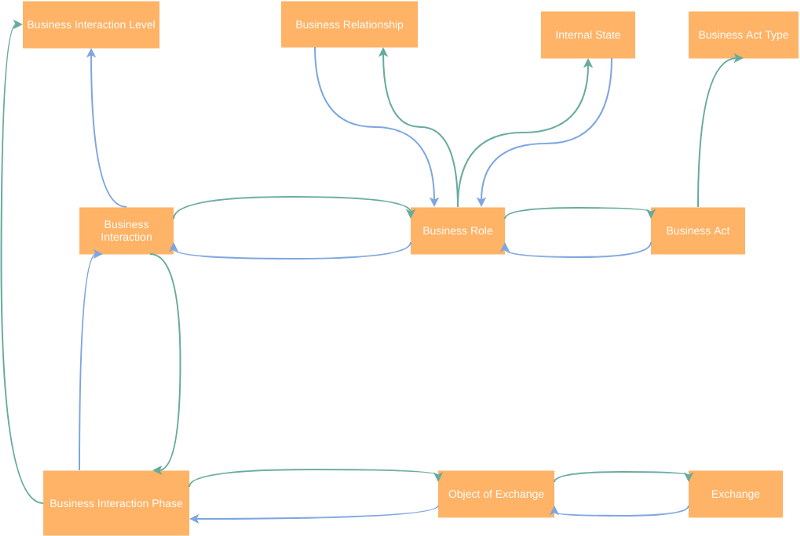
Przykład diagramu interakcji biznesowej
Przykład diagramu interakcji — Mały szpital
(*Źródło — Przewodnik analizy biznesowej PMI)
Mały szpital martwił się o wydajność swoich lekarzy, ponieważ byli najdroższymi pracownikami i kluczowymi dla leczenia pacjentów. Po podjęciu licznych kroków w celu zapewnienia wysokiej wydajności, kierownictwo szpitala było zaskoczone, gdy wydajność stale malała z miesiąca na miesiąc.
Ponieważ ten rozwój był niewytłumaczalny, kierownictwo postanowiło uzyskać wgląd w przyczyny i skutki różnych czynników. Zdecydowali się stworzyć diagram interakcji i uwzględnić w analizie następujące czynniki:
- Liczba zaplanowanych wizyt na lekarza
- Liczba wizyt awaryjnych na lekarza
- Obciążenie administracyjne na lekarza
- Liczba zmian w zaplanowanych wizytach
- Jakość i niezawodność sprzętu
- Dostępność pielęgniarek
- Dostępność innych funkcji wsparcia
- Poziomy wynagrodzeń lekarzy
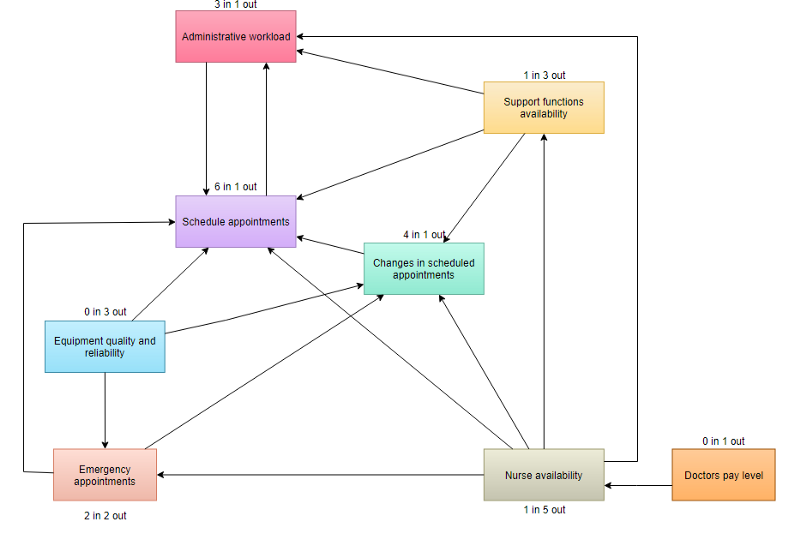
Interpretacja wyniku diagramu
Wysoka liczba wychodzących strzałek wskazuje, że problem jest czynnikiem lub możliwą przyczyną. Zespół zazwyczaj ocenia te problemy jako pierwsze, aby uzyskać najbardziej dalekosiężne wyniki. Wysoka liczba przychodzących strzałek wskazuje, że problem jest wynikiem. Te problemy mogą służyć jako ważne wskaźniki sukcesu.
- Policz strzałki przychodzące i wychodzące dla każdego pomysłu. Zapisz liczby na dole każdego pola. Te z największą liczbą strzałek to kluczowe pomysły.
- Zauważ, które pomysły mają głównie wychodzące strzałki. To są podstawowe przyczyny lub czynniki.
- Zauważ, które pomysły mają głównie przychodzące strzałki. To są ostateczne efekty, które mogą być również krytyczne do rozwiązania.
- Upewnij się, że sprawdzisz, czy pomysły z mniejszą liczbą strzałek również są kluczowymi pomysłami. Liczba strzałek jest tylko wskaźnikiem, a nie absolutną zasadą. Narysuj pogrubione linie wokół kluczowych pomysłów.
Ten post dostępny jest również w Deutsch, English, Español, فارسی, Français, Bahasa Indonesia, 日本語, Portuguese, Ру́сский, Việt Nam, 简体中文 and 繁體中文


