Mapowanie strumienia wartościjest techniką identyfikacji i eliminacji marnotrawstwa procesów. Jest to specjalny rodzaj diagramu przepływu, który używa symboli zwanych „językiem lean” do opisywania i poprawy przepływu zapasów i informacji. Pomaga nam dostarczać klientom najlepszą wartość poprzez kompletny proces tworzenia wartości i minimalizować marnotrawstwo w następujących aspektach:
- Projektowanie(Od pomysłu do klienta)
- Budowanie(Od zamówienia do dostawy)
- Utrzymanie(W użyciu przez cykl życia do serwisu)
Czym jest wartość dla klientów?
Wartość to to, co klient kupuje, czyli zdolność dostarczana klientowi. Produkt lub usługi dostarczane klientowi powinny być:
- Najwyższej jakości
- W odpowiednim czasie
- W odpowiedniej cenie określonej przez klienta
W rzeczywistości działania, które rzeczywiście tworzą wartość dla klientów, stanowią tylko małą część całego procesu pracy. Dlatego firmy powinny skupić się na redukcji marnotrawnych działań w jak największym stopniu. Dzięki temu firmy mogą zidentyfikować istotne możliwości poprawy swojej ogólnej wydajności.
Czym jest marnotrawstwo?
Daniel T. Jones (1995) identyfikuje siedem powszechnie akceptowanych typów marnotrawstwa. Te terminy zostały zaktualizowane z oryginalnej nomenklatury systemu produkcyjnego Toyoty:
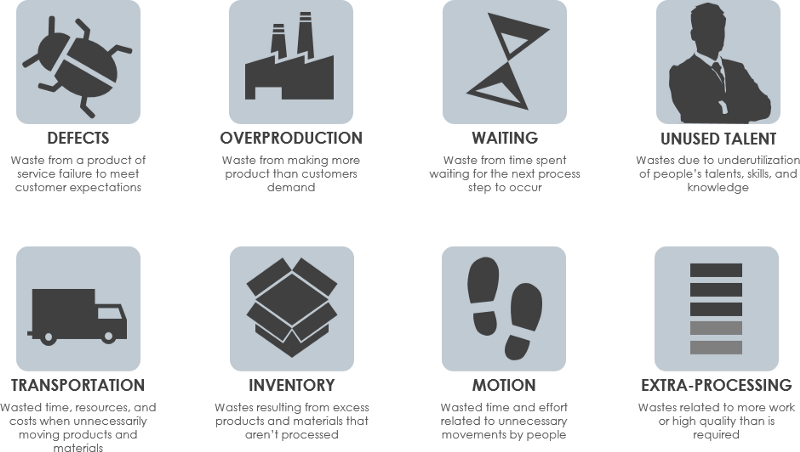
- Zapas:Zakup i przechowywanie surowców oraz gromadzenie pracy w toku w oczekiwaniu na przyszłe procesy to marnotrawstwo.
- Czekanie:W serii kroków przetwarzania materiału, jeśli jeden z kroków jest wolny, to gromadzi pracę w toku, co jest marnotrawstwem.
- Wady:Ostatecznie najważniejszym i najpowszechniejszym typem są wady. Wady są nieakceptowalne dla klientów. Aby tego uniknąć, należy ustanowić proces kontroli jakości oraz proces przeróbek, co zwiększa koszty. Dlatego wady są główną formą marnotrawstwa.
- Nadprodukcja:Produkcja przedmiotów, które są w nadmiarze w stosunku do popytu klientów.
- Ruch:Niepotrzebny ruch maszyn i ruchy operatorów mogą powodować zużycie i zmęczenie.
- Transport:Jakikolwiek niepotrzebny ruch pracy w toku lub surowców jest formą marnotrawstwa. Może to powodować uszkodzenia materiałów i może również zwiększać czas cyklu produkcji, a tym samym jest marnotrawstwem.
- Nadprzetwarzanie:Dostarczanie funkcji, które nie są wymagane przez klientów, oraz dostosowywanie do poziomów wyższych niż te określone przez klientów, zwiększa koszty produkcji, co jest marnotrawstwem.
Czym jest analiza strumienia wartości?
Mapowanie strumienia wartości (VSM) to podstawowa technika identyfikacji marnotrawstwa i redukcji marnotrawstwa procesów. Jest to niezbędne narzędzie lean dla organizacji, która chce planować, wdrażać i poprawiać podczas swojej drogi lean. Pomaga użytkownikom stworzyć solidny plan wdrożenia, który zmaksymalizuje dostępne zasoby i pomoże zapewnić efektywne wykorzystanie materiałów i czasu. Analiza strumienia wartości to potężne narzędzie planistyczne do optymalizacji wyników eliminacji marnotrawstwa.
VSM jasno pokazuje czas i wysiłek poświęcany na działania, które nie dodają wartości, koszty prowadzenia działalności oraz przygotowuje grunt do redukcji marnotrawstwa i uproszczenia procesu. Celem mapowania strumienia wartości jest maksymalizacja wartości i minimalizacja marnotrawstwa na kilka różnych sposobów, w tym:
- Ułatwienie jasnej komunikacji i współpracy
- Zachęcanie do ciągłego doskonalenia procesu
- Umożliwienie zmiany kultury w organizacji
- Tworzenie wizualizacji opóźnień, nadmiaru zapasów i ograniczeń produkcyjnych
Operacje dodające wartość vs operacje nie dodające wartości
Eliminacja marnotrawnych działań jest kluczowa dla sukcesu Twojej firmy. Mogą one obniżać rentowność, zwiększać koszty dla klientów, obniżać jakość, a nawet satysfakcję pracowników. Z tego powodu musisz zidentyfikować działania, które nie dodają wartości, i spróbować poprawić proces, w którym się pojawiają, lub ostatecznie je wyeliminować.
Nie popełnij błędu. Nie wszystkie marnotrawne działania mogą być wyeliminowane z Twojego procesu pracy. Niektóre z nich są konieczne.
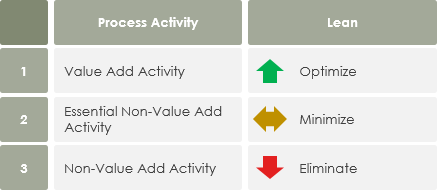
Monden (1994) identyfikuje trzy typy operacji:
- Operacje nie dodające wartości (NVA): działania, które powinny być wyeliminowane, takie jak czekanie.
- Konieczne, ale nie dodające wartości (NNVA): działania, które są marnotrawne, ale konieczne w ramach obecnych procedur operacyjnych.
- Dodające wartość (VA): przetwarzanie lub obróbka surowców za pomocą pracy ręcznej.
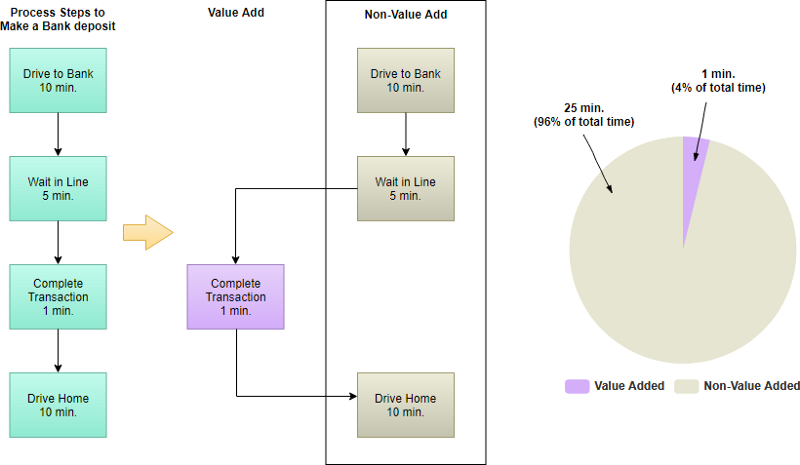
Podsumowując, działania dodające wartość powinny być dalej optymalizowane w celu dążenia do ciągłego doskonalenia i wzrostu organizacji, podczas gdy działania nie dodające wartości powinny być eliminowane lub przynajmniej minimalizowane w jak największym stopniu.
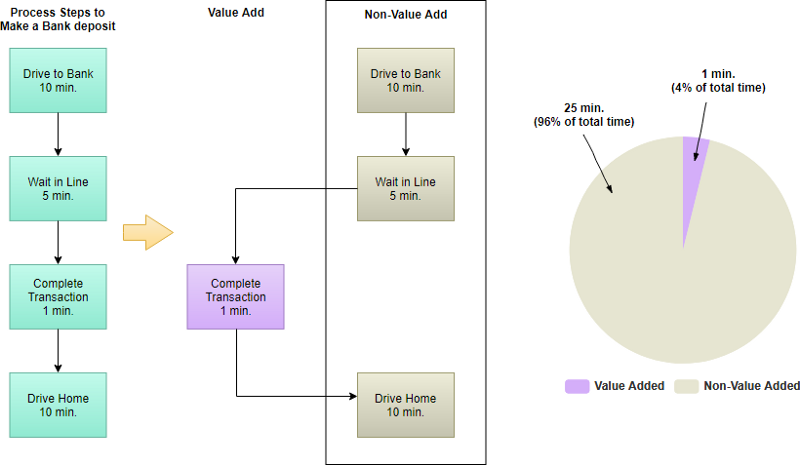
Przykład wartości i działań nie dodających wartości — wpłata pieniędzy w bankomacie
Z mapy strumienia wartości obecnego stanu do mapy strumienia wartości przyszłego stanu
Jak wspomniano wcześniej, analiza strumienia wartości jest narzędziem planistycznym do optymalizacji wyników eliminacji marnotrawstwa. Jeśli stworzysz tylko mapę obecnego stanu, to przegapisz cel VSM. Mapa przyszłego stanu to obraz procesu transformacji lean dla konkretnego strumienia wartości. Zanim stworzysz mapę przyszłego stanu, powinieneś już stworzyć mapę strumienia wartości obecnego stanu.
Analiza strumienia wartości wizualnie mapuje przepływ kroków, opóźnień i informacji potrzebnych do dostarczenia produktu lub usługi; nazywa się to mapą „aktualnego stanu”. Mapa przyszłego stanu identyfikuje poprawki, które należy wprowadzić w strumieniu wartości, aby skrócić całkowity czas realizacji.
Aby stworzyć skuteczną mapę przyszłego stanu, należy wziąć pod uwagę następujące kwestie:
- Wybierz produkt do mapowania strumienia wartości
- Stwórz mapę aktualnego strumienia wartości
- Eliminuj marnotrawstwo i stwórz bardziej efektywną mapę przyszłego stanu
- Stwórz plan wdrożenia
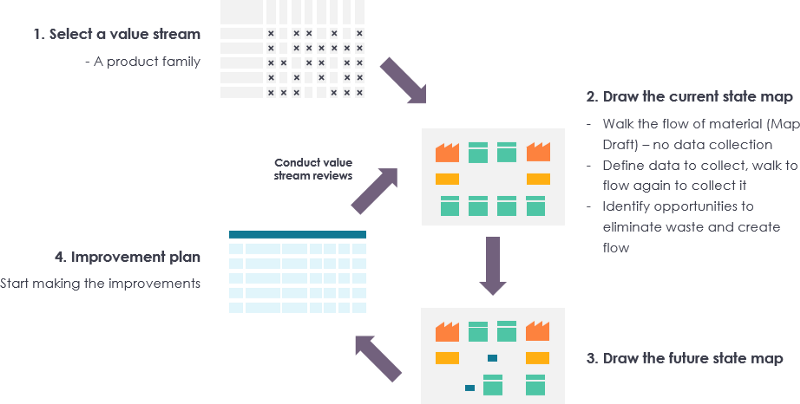
Na koniec powinieneś stworzyć plan wdrożenia strumienia wartości, aby osiągnąć przyszły stan. Teraz masz plan dla szczupłego strumienia wartości, który możesz wykorzystać do śledzenia/mierzenia swoich postępów przez cały rok. Upewnij się, że masz „menedżera strumienia wartości” lub kierownika projektu, który doprowadzi plan do realizacji.
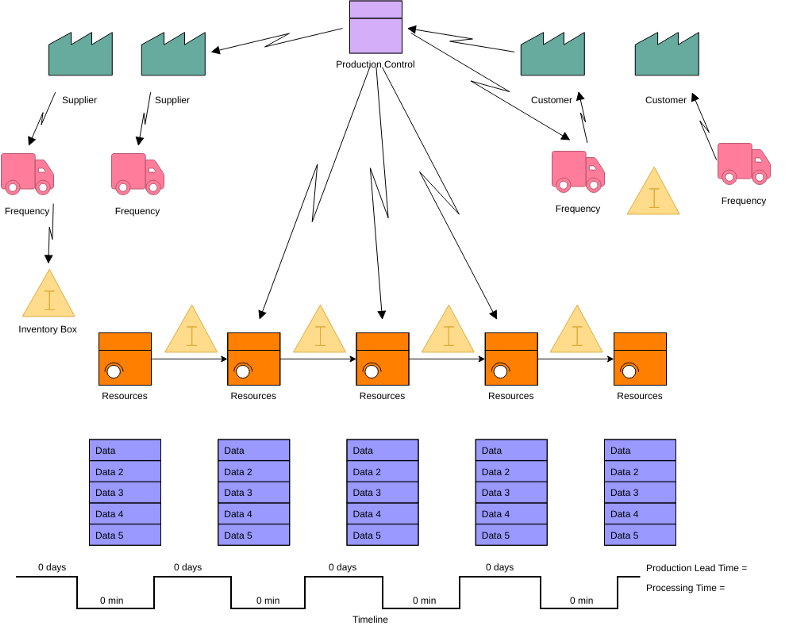
Przykład analizy strumienia wartości — Kontrola produkcji
Mapowanie strumienia wartości — Inny przykład
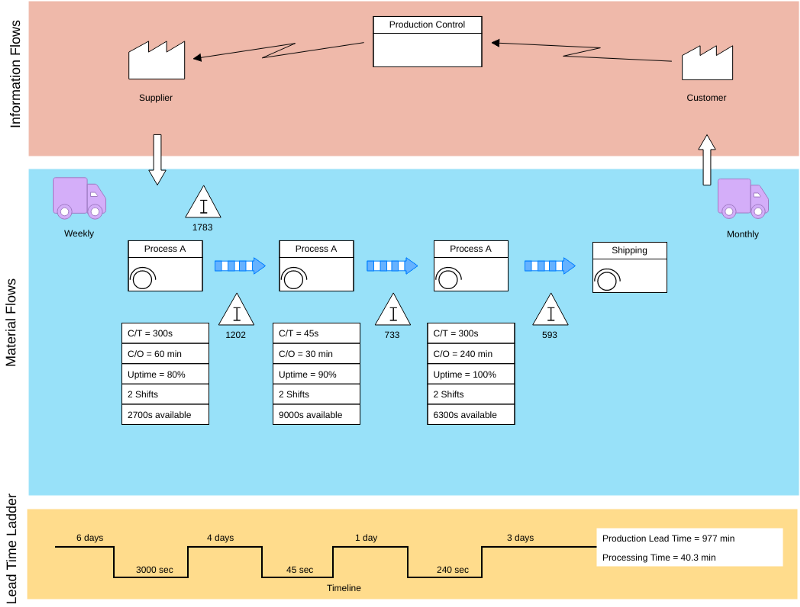
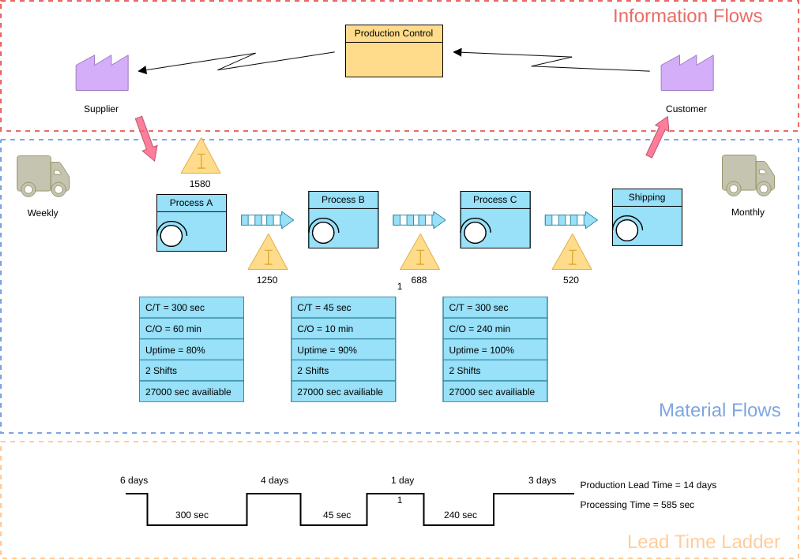
Mapy strumienia wartości można stworzyć, postępując zgodnie z poniższymi krokami:
- Pierwszym krokiem w mapowaniu strumienia wartości jest narysowanie PUDEŁ PROCESOWYCH dla różnych kroków procesów, zaczynając od strony dostawcy aż do strony klienta w obszarze przepływów informacyjnych.
- Drugim krokiem jest narysowanie różnych typów pudeł procesowych dla różnych rodzajów kroków produkcyjnych w sekcji przepływu informacji zwanej przepływami materiałów.
- Trzecim krokiem w mapowaniu strumienia wartości są PUDEŁKA DANYCH tuż pod każdym z procesów (lub kroków produkcyjnych), w których gromadzone są dane dotyczące każdego z kroków procesów narysowanych na mapie. Informacje, które mogą być interesujące dla projektu VSM, można tu umieścić.
- Czwartym krokiem jest narysowanie METOD POŁĄCZENIA między pudełkami procesowymi.
- Piąty krok opisuje łączenie KLIENTÓW I DOSTAWCÓW z procesem.
- Piąty krok to DRABINA CZASU REALIZACJI na dole VSM, która pokazuje różne aspekty czasu w strumieniu wartości.
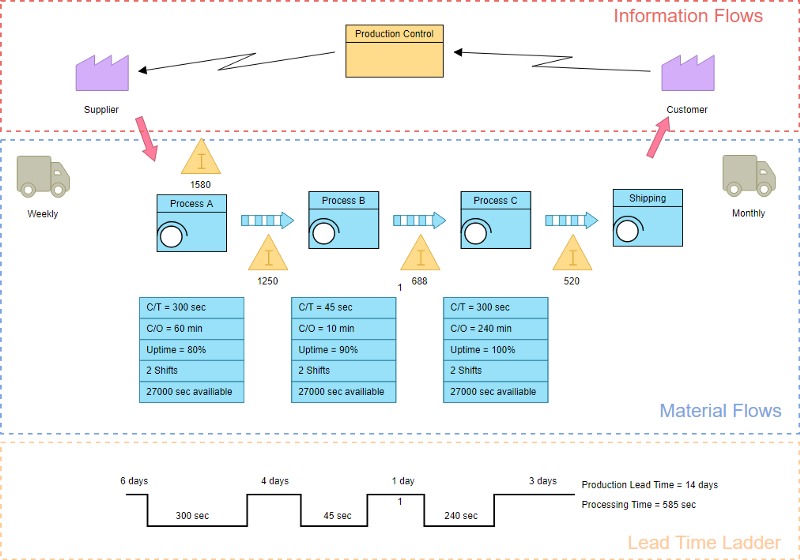
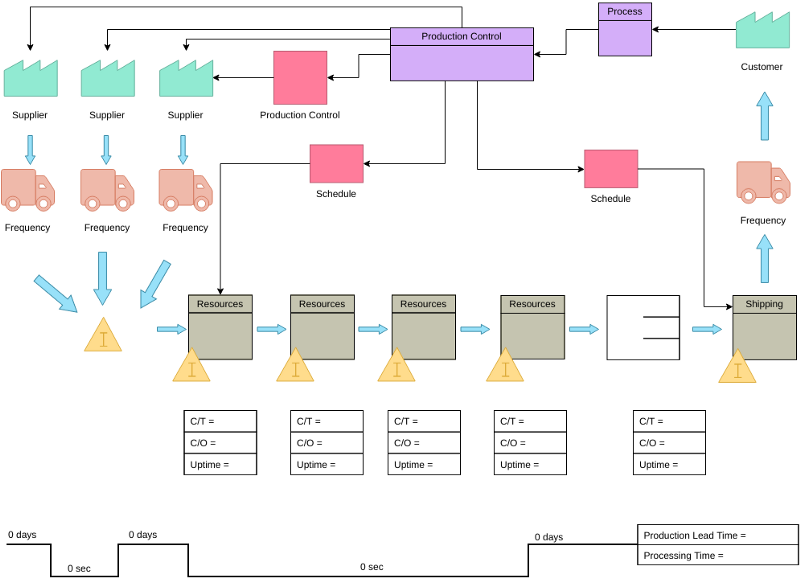
Poniższy przykład pokazuje, jak może wyglądać typowa mapa strumienia wartości:
Opracowanie ciągłego planu wdrożenia
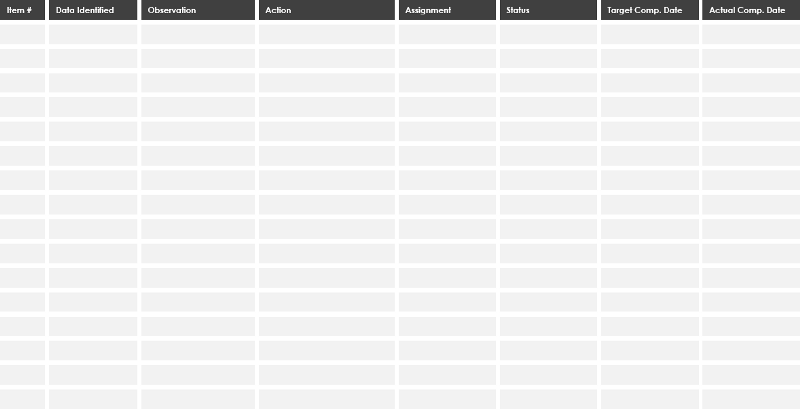
VSM pomaga użytkownikom stworzyć solidny plan wdrożenia, który maksymalizuje dostępne zasoby i pomaga zapewnić efektywne wykorzystanie materiałów i czasu. Na podstawie informacji dostarczonych przez mapę przyszłego stanu możemy teraz opracować plan wdrożenia dla działań potrzebnych do przejścia od aktualnego stanu do przyszłego stanu. Oto ogólny szablon:
Składniki mapowania strumienia wartości
Symbole / Opis

Klient/Dostawca: reprezentuje Dostawcę, gdy znajduje się w lewym górnym rogu, Klienta, gdy znajduje się w prawym górnym rogu, zwykły punkt końcowy dla materiału

Dedykowany przepływ procesów: proces, operacja, maszyna lub dział, przez który przepływają materiały. Reprezentuje jeden dział z ciągłym, wewnętrznym, stałym przepływem.

Wspólny proces: proces, operacja, dział lub 11 Wspólny proces: proces, operacja lub dział, który dzielą inne rodziny strumienia wartości.

Pudełko danych: zawiera istotne informacje/dane potrzebne do analizy i obserwacji systemu.

Komórka robocza: wskazuje, że wiele procesów jest zintegrowanych w komórkę roboczą produkcji.

Zapas: pokazuje zapas między dwoma procesami

Wysyłki: reprezentuje ruch surowców od dostawców do doków odbiorczych fabryki. Lub ruch gotowych produktów z doków wysyłkowych fabryki do klientów

Strzałka pchająca: reprezentuje „pchnięcie” materiału z jednego procesu do następnego.

Supermarket: „supermarket” zapasów.

Pociąganie materiału: supermarkety łączą się z procesami w dół strumienia za pomocą tego „Pociągania”, które wskazuje na fizyczne usunięcie.

Pas FIFO: Zapas First-In-First-Out. Użyj go, gdy procesy są połączone z systemem FIFO, który ogranicza wejście.

Zapas bezpieczeństwa: reprezentuje „hedż” zapasów (lub zapas bezpieczeństwa) przeciwko problemom takim jak przestoje, aby chronić system przed nagłymi wahaniami w zamówieniach klientów lub awariami systemu.

Wysyłka zewnętrzna: wysyłki od dostawców lub do klientów przy użyciu transportu zewnętrznego

Kontrola produkcji: to pole reprezentuje centralny dział planowania lub kontroli produkcji, osobę lub operację.

Informacje ręczne: prosta, cienka strzałka pokazuje ogólny przepływ informacji z notatek, raportów lub rozmów. Częstotliwość i inne uwagi mogą być istotne.

Informacje elektroniczne: ta falista strzałka reprezentuje przepływ elektroniczny, taki jak elektroniczna wymiana danych (EDI), Internet, intranety, sieci LAN (lokalne) i WAN (szerokopasmowe). Możesz wskazać częstotliwość wymiany informacji/danych, rodzaj użytych mediów, np. faks, telefon itp. oraz rodzaj wymienianych danych.

Kanban produkcji: uruchamia produkcję zdefiniowanej liczby części. Sygnalizuje proces dostaw, aby dostarczyć części do procesu następnego.

Kanban wycofany: reprezentuje kartę lub urządzenie, które instruuje operatora materiałowego do przeniesienia części z supermarketu do procesu odbioru. Operator materiałowy (lub operator) udaje się do supermarketu i wycofuje potrzebne przedmioty.

Kanban sygnałowy: używany, gdy poziomy zapasów w supermarkecie między dwoma procesami spadają do punktu wyzwalającego lub minimalnego. Nazywany jest również Kanbanem „jeden na partię”.

Post Kanban: miejsce, w którym znajdują się sygnały Kanban do odbioru. Często używane z systemami dwóch kart do wymiany Kanban wycofania i produkcji.

Pociągnięcie sekwencyjne: reprezentuje system pociągnięcia, który daje instrukcje do procesów podmontażu, aby wyprodukować z góry określony typ i ilość produktu, zazwyczaj jedną jednostkę, bez użycia supermarketu.

Wyrównanie obciążenia: narzędzie do grupowania Kanban w celu wyrównania objętości produkcji i mieszanki w czasie.

Idź zobaczyć produkcję: gromadzenie informacji za pomocą środków wizualnych

Informacje werbalne: reprezentuje przepływ informacji werbalnych lub osobistych

Kaizen: używany do podkreślenia potrzeb poprawy i planowania warsztatów kaizen w określonych procesach, które są kluczowe dla osiągnięcia Mapy Przyszłego Stanu strumienia wartości.

Operator: reprezentuje operatora. Pokazuje liczbę operatorów potrzebnych do przetwarzania rodziny VSM w danym stanowisku pracy.

Inne informacje: inne przydatne lub potencjalnie przydatne informacje.

Oś czasu: pokazuje czasy dodane wartości (czasy cyklu) i czasy nie dodane wartości (czasy oczekiwania). Użyj tego do obliczenia czasu realizacji i całkowitego czasu cyklu.
Terminologia mapy strumienia wartości
- C/T (Czas cyklu): Czas cyklu procesora = Czas na wykonanie zadania.
- P/T lub C/O (Czas przezbrojenia): Czas nie dodany wartości wymagany do przekształcenia linii z jednego produktu na inny, czas przezbrojenia lub czas przygotowania do rozpoczęcia nowego zadania.
- VA (Zadanie dodane wartości): Czas dodany wartości lub czas potrzebny do wykonania wymaganego zadania.
- NVA (Zadanie nie dodane wartości): Czas nie dodany wartości = PT — VAT.
- L/T (Czas realizacji): Czas realizacji, czyli całkowity czas od momentu rozpoczęcia zadania w obrębie centrum pracy do momentu opuszczenia centrum pracy.
- FTT (Pierwsze przejście): Jakość pierwszego przejścia lub wydajność jakości pierwszego przejścia.
- T/T (Czas taktowy): Średni czas produkcji jednostkowej potrzebny do zaspokojenia popytu klientów.
- Wydajność: Metryka, która wskazuje, ile części dziennie może obsłużyć twój najwolniejszy proces.
Narzędzie do mapowania strumienia wartości
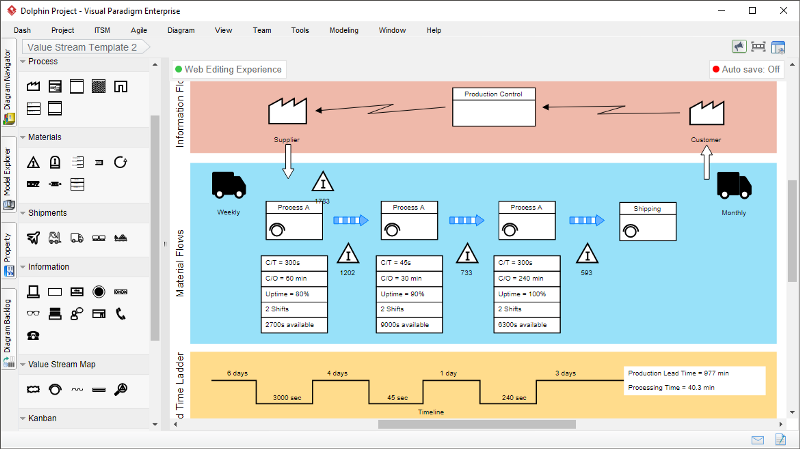
Szukasz oprogramowania VSM? Oprogramowanie do mapowania strumienia wartości Visual Paradigmmożna łatwo i szybko tworzyć profesjonalne mapowanie strumienia wartości. Narzędzie do mapowania strumienia wartości zawiera bogaty zestaw symboli mapowania strumienia wartości. Dzięki edytorowi VSM z funkcją przeciągnij i upuść oraz potężnemu zestawowi funkcji, możesz łatwo tworzyć profesjonalne mapy strumienia wartości.
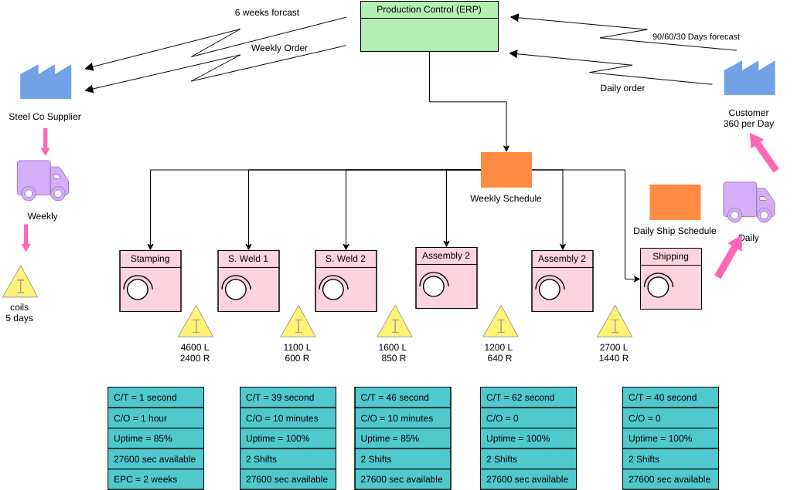
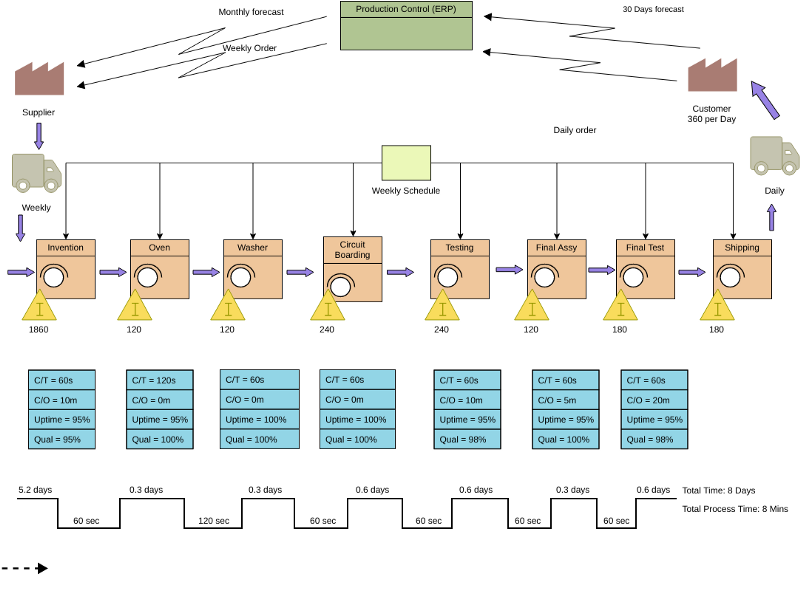
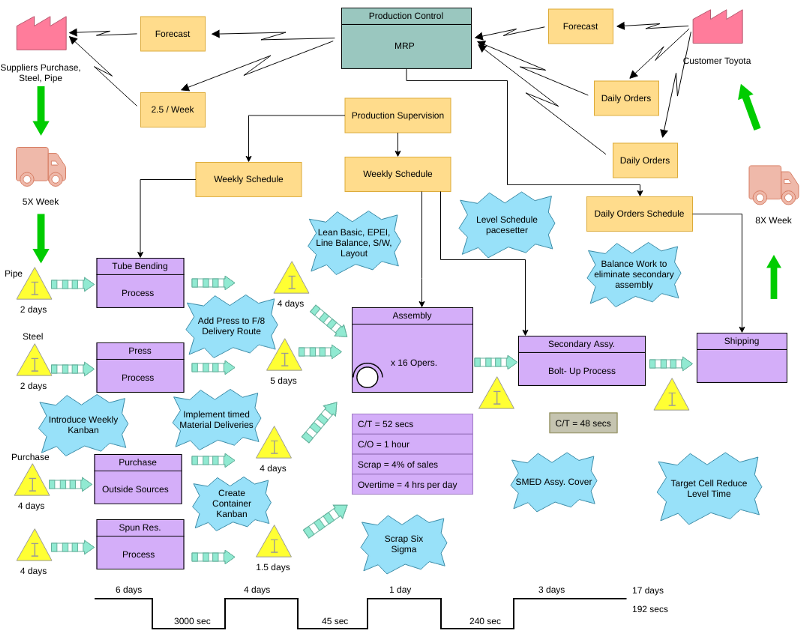
Ucz się na przykładach — Szablony mapowania strumienia wartości
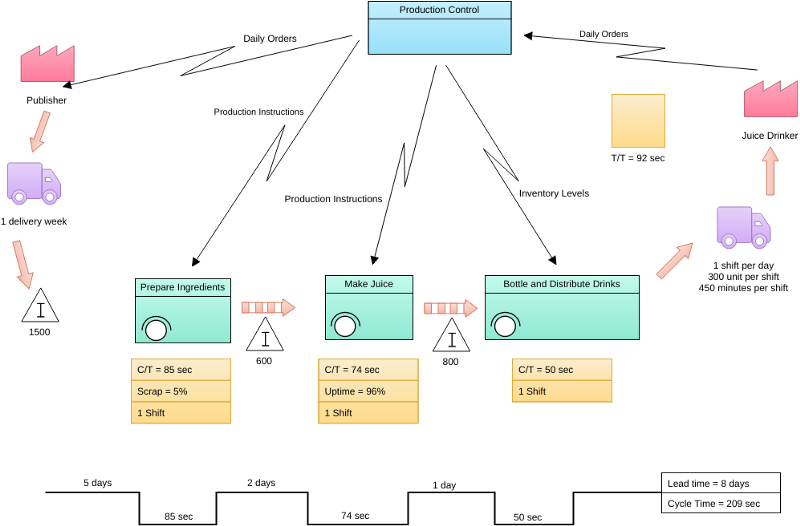
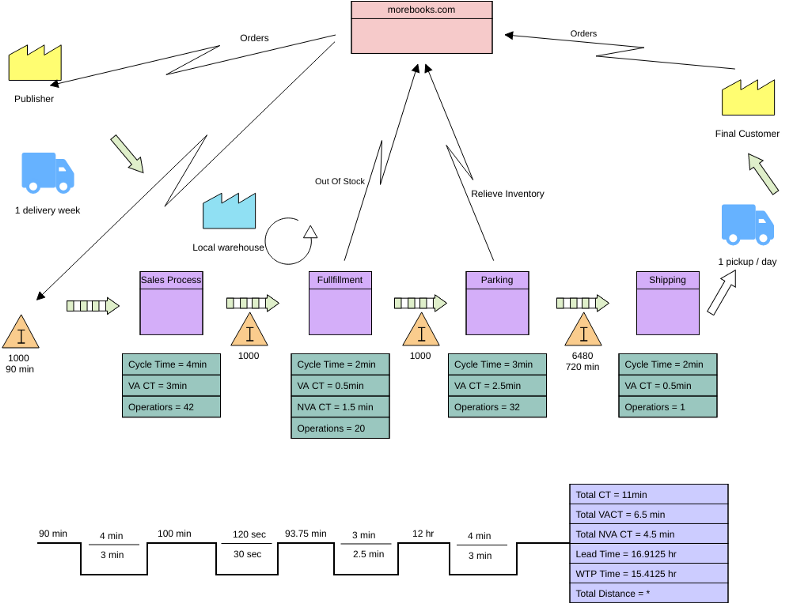
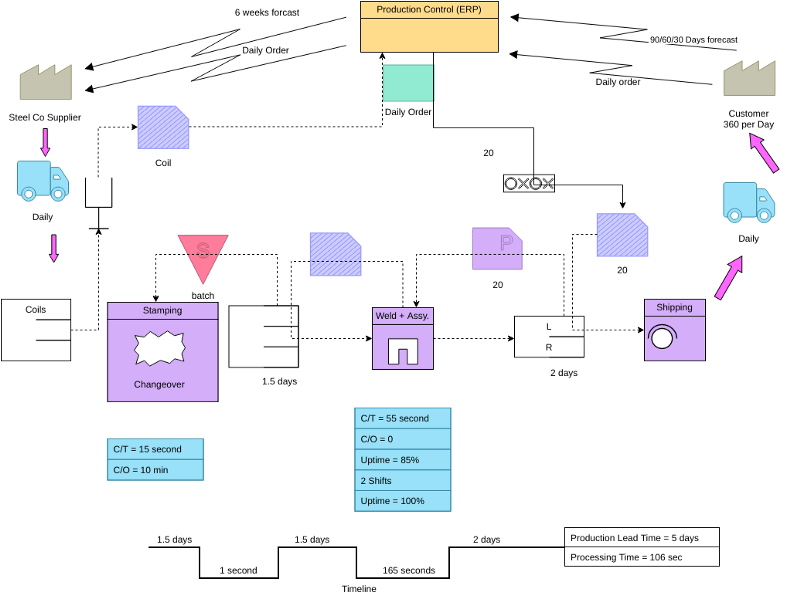
Możesz je wypróbować i edytować online, klikając poniższy link do przykładu:
Ten post dostępny jest również w Deutsch, English, Español, فارسی, Français, Bahasa Indonesia, 日本語, Portuguese, Ру́сский, Việt Nam, 简体中文 and 繁體中文


