In the intricate landscape of planning and strategy, finding a reliable map is crucial to navigate the complexities and uncertainties that often accompany our goals. Enter the Fishbone Diagram, a dynamic visual tool that has proven to be an indispensable companion in the realms of planning and problem-solving.
Embark on a journey with us as we delve into the history and evolution of the Fishbone Diagram, also known as the Ishikawa or Cause-and-Effect diagram. Originating from quality management practices, this diagram has transcended its roots to become a versatile and widely adopted planning map across various industries.
Understanding the Anatomy:
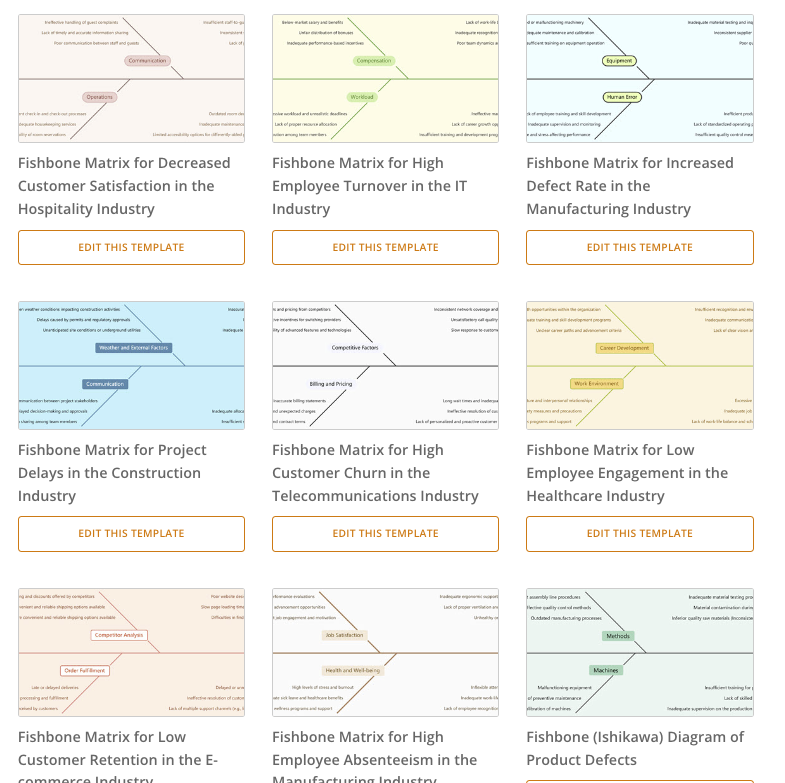
Unpacking the anatomy of the Fishbone Diagram, we explore its unique structure, which resembles a fish skeleton. Each “bone” represents a category of factors influencing a specific aspect of your plan. We showcase how this categorization allows for a holistic analysis, ensuring no stone is left unturned when it comes to potential challenges or opportunities.
Strategic Planning Unleashed:
As we unravel the layers of strategic planning, we highlight real-world scenarios where the Fishbone Diagram has been instrumental in fostering success. Whether you’re mapping out a project timeline, troubleshooting issues, or setting organizational objectives, this diagram serves as a compass, providing direction and clarity in the planning process.
Anticipating Challenges and Fostering Understanding:
One of the Fishbone Diagram’s key strengths lies in its ability to help identify root causes of problems or challenges. We explore how this feature aids in anticipating potential obstacles and establishing a deeper understanding of the interconnected factors influencing your plan. By visually connecting the dots, the Fishbone Diagram empowers planners to make informed decisions and mitigate risks effectively.
The Perfect Tool to Help You Get Started:

Enhance your Fishbone Diagram creation experience with Visual Paradigm Smart Board, a cutting-edge, free tool designed to streamline your planning process. Seamlessly integrate brainstorming sessions, collaborate in real-time, and effortlessly generate Fishbone Diagrams with this intuitive platform.
Visual Paradigm Smart Board empowers you to turn your ideas into actionable plans, providing a dynamic and visually engaging environment for effective collaboration. Elevate your planning game with this innovative tool, ensuring that your Fishbone Diagrams are not just charts but strategic roadmaps. Try Visual Paradigm Smart Board today and witness the transformation of your planning endeavors.
Conclusion:
In conclusion, the Fishbone Diagram emerges as a robust planning map, guiding individuals and teams through the complexities of strategic thinking. Its adaptability and simplicity make it a go-to tool for anyone seeking to enhance their planning process. Join us in acknowledging the Fishbone Diagram not just as a diagram but as an ally in the pursuit of successful planning and execution. As you embark on your planning endeavors, consider the Fishbone Diagram your trusted companion, ready to unravel the path to success.

