In the digital age, online book stores have become a staple for book lovers worldwide. The convenience of browsing, purchasing, and reading books from the comfort of one’s home has revolutionized the way we consume literature. Infographics play a crucial role in understanding the dynamics of online book stores, from consumer behavior to market trends. This article explores how infographics can help us comprehend the intricacies of online book stores and their impact on the publishing industry.

The Rise of Online Book Stores
Online book stores have seen a significant rise in popularity, especially with the advent of e-readers and the increasing preference for digital content. According to data, the eCommerce sales value of books and magazines in the US reached approximately $18.6 billion in 2020, marking a 27.40% increase from the previous year1. This growth can be attributed to the convenience and accessibility offered by online platforms, which allow readers to purchase books with just a few clicks.
Consumer Behavior and Preferences
Understanding consumer behavior is essential for online book stores to tailor their offerings and marketing strategies. Infographics can visually represent data on consumer preferences, such as the most popular genres, preferred formats (eBooks, audiobooks, or physical books), and purchasing habits. For instance, an infographic might show that while e-readers have become popular, there is still a significant preference for physical books across all generations2. This insight can help online book stores stock the right mix of products to cater to diverse customer needs.
Market Trends and Insights
Infographics can also provide valuable insights into market trends, helping online book stores stay competitive. For example, data visualization can highlight the peak seasons for book sales, the impact of promotional activities, and the performance of different book categories. An infographic might reveal that the most profitable period for book stores was between 2003 and 2008, largely due to the Harry Potter franchise’s simultaneous release of films and books3. Such trends can inform strategic planning and marketing efforts.
The Role of Data Visualization
Data visualization is a powerful tool for online book stores to make informed decisions. By transforming complex data into easy-to-understand visuals, infographics can help identify patterns, trends, and opportunities. For example, a probability distribution chart based on past transactions can predict future buying behaviors, enabling online book stores to invest in the right inventory4. Additionally, visual summaries of popular business and personal development books can provide quick insights, making it easier for professionals to stay informed without reading entire books5.
Engaging Different Generations
Online book stores cater to a diverse audience, from millennials to baby boomers. Infographics can illustrate the reading habits of different generations, helping book stores tailor their offerings accordingly. For instance, an infographic might show that Gen X reads more online news, while Baby Boomers rely on best-seller lists to find their books2. This information can guide content curation and marketing strategies to better engage each demographic.
The Impact of Technology
Technology has significantly influenced the way we consume books. Infographics can highlight the role of e-readers, audiobooks, and digital platforms in shaping the modern reading experience. For example, the number of e-reader users is projected to grow from 950.5 million in 2019 to 1.11 billion by next year, indicating a continued preference for digital reading options1. This trend can inform online book stores’ investment in digital content and e-reader compatibility.
Creating Professional Infographics with Visual Paradigm Online
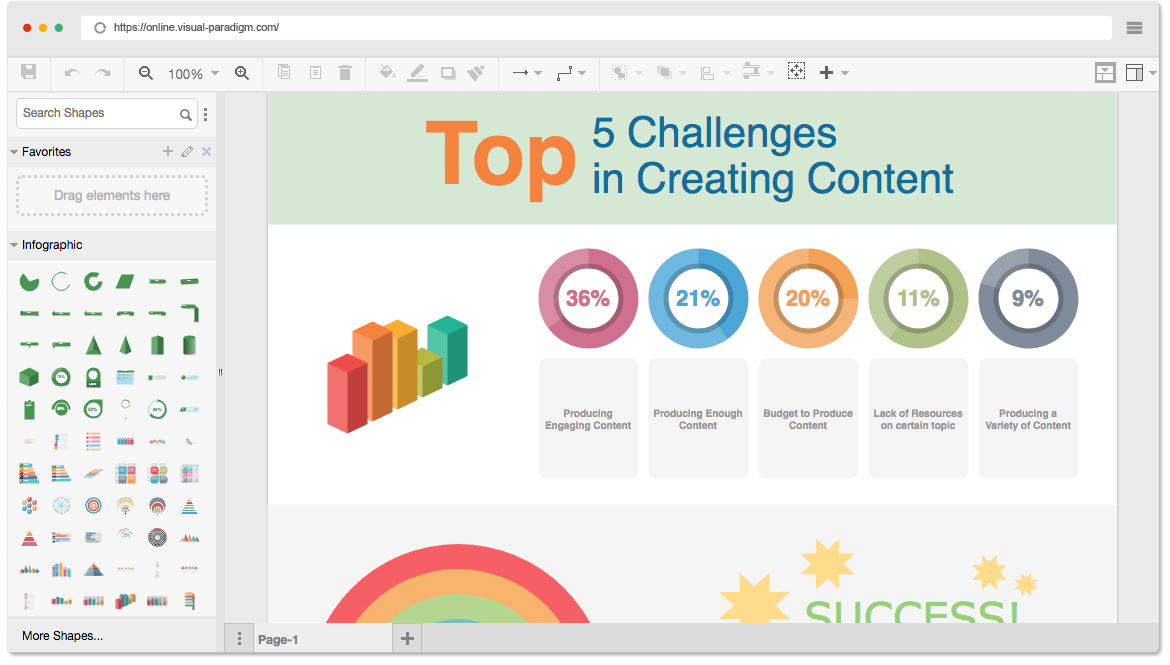
Visual Paradigm Online is a powerful tool that makes creating professional infographics easy and efficient. Here’s how you can use it to create an infographic for your online book store:

Step-by-Step Guide
- Sign Up and Log In:
- Visit the Visual Paradigm Online website and sign up for an account.
- Log in to access the dashboard.
- Choose a Template:
- Browse through the extensive library of infographic templates.
- Select a template that best fits the data and story you want to convey about your online book store.
- Customize Your Infographic:
- Add Data: Input your data into the template. You can use charts, graphs, and other visual elements to represent your information.
- Edit Design Elements: Customize colors, fonts, and layouts to match your brand’s aesthetic.
- Insert Icons and Images: Use relevant icons and images to make your infographic more engaging and visually appealing.
- Tell a Story:
- Arrange your data in a logical flow to tell a coherent story.
- Use headings, subheadings, and annotations to guide the viewer through the infographic.
- Review and Publish:
- Review your infographic for accuracy and clarity.
- Once satisfied, publish your infographic. You can download it in various formats or share it directly from the platform.
Key Features of Visual Paradigm Online
- User-Friendly Interface: Easy to navigate and use, even for beginners.
- Customization Options: Extensive customization tools to tailor your infographic to your specific needs.
- Professional Templates: A wide range of professionally designed templates to choose from.
- Collaboration Tools: Work with your team in real-time to create and edit infographics.
- Export Options: Download your infographic in various formats, including PDF, PNG, and PowerPoint.

By using Visual Paradigm Online, you can create impactful infographics that effectively communicate the story of your online book store. Whether you’re showcasing market trends, consumer behavior, or the impact of technology, Visual Paradigm Online makes the process straightforward and professional.
Conclusion
Infographics are invaluable for understanding the complexities of online book stores. By visualizing data on consumer behavior, market trends, and technological impacts, online book stores can make informed decisions, tailor their offerings, and stay competitive in the ever-evolving publishing industry. As the popularity of online book stores continues to grow, leveraging the power of visualization will be key to their success. With tools like Visual Paradigm Online, creating professional and engaging infographics has never been easier.
References
Tools and Templates
- The Best Free Tools to Create Professional Infographics
- URL: Cybermedian
- Description: This article discusses various free tools, including Visual Paradigm Online, that help create professional infographics even without design skills8.
- Free Infographics, Poster, Flyer Templates and More
- URL: Visual Paradigm Online
- Description: Offers a variety of free templates for creating infographics, posters, flyers, and more, making it easy to design compelling visuals quickly9.
- Online Infographic Maker
- URL: Visual Paradigm Online
- Description: A versatile online graphic design software that helps create beautiful infographics with customizable maps, icons, photos, and illustrations10.
- How to Find Keywords for SEO Infographic
- URL: Visual Paradigm Online
- Description: This template helps in finding keywords for SEO, offering a customizable design that can be tailored to specific needs11.
- Big Data Analytics Horizontal Infographic
- URL: Visual Paradigm Online
- Description: A designer-crafted template for big data analytics, fully customizable to suit various content and design requirements12.
- Infographic for the Tips of Study
- URL: Visual Paradigm Online
- Description: A customizable infographic template designed to provide study tips, helping users create visually appealing and informative study guides13.
- InfoART – Dynamic Infographics Content Blocks
- URL: Visual Paradigm Online
- Description: InfoART offers dynamic content blocks that can be customized for various visual representation needs, enhancing the effectiveness of infographics14.
- Free Infographic Maker
- URL: Visual Paradigm Online
- Description: A free infographic maker that enables users to design high-quality infographics easily, with access to a wide range of design types and high-resolution stock photos15.
These resources provide a comprehensive guide to creating professional and engaging infographics, leveraging the power of visualization to communicate complex information effectively.

