Introduction
Unified Modeling Language (UML) diagrams are essential tools in software engineering, providing a standardized way to visualize the design of a system. UML diagrams are categorized into three main types: Structural Diagrams, Behavioral Diagrams, and Interaction Diagrams. Each type serves a unique purpose in the software development lifecycle, offering insights into different aspects of the system’s architecture and behavior.
Structural Diagrams
Structural diagrams depict the static view or structure of a system. They are widely used in documenting software architecture and provide an outline of the system, emphasizing the elements that need to be modeled.
1. Class Diagram
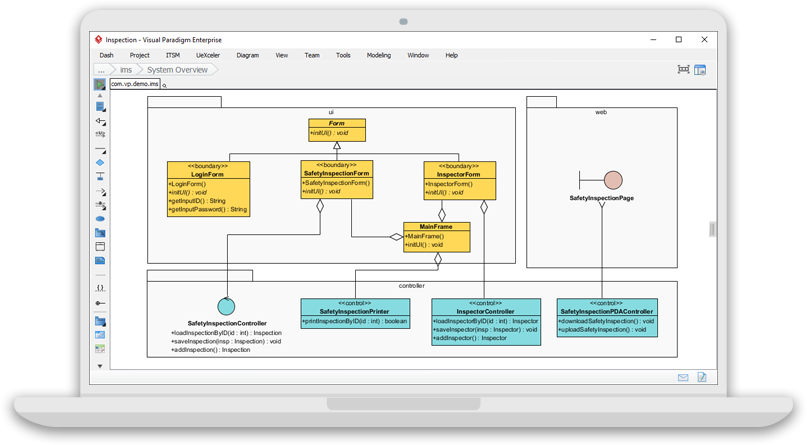
Class diagrams are the backbone of all object-oriented software systems. They depict the static structure of the system, displaying the system’s classes, attributes, and methods. Class diagrams are instrumental in recognizing the relationships between different objects and classes, making them one of the most widely used UML diagrams.
2. Composite Structure Diagram
Composite structure diagrams show the parts within a class and the relationships between these parts. They utilize ports, parts, and connectors to portray the internal structure of a structured classifier. Unlike class diagrams, composite structure diagrams represent individual parts in a more detailed manner.
3. Object Diagram
Object diagrams describe the static structure of a system at a particular point in time. They represent distinct instances of classes and the relationships between them. Object diagrams can be used to test the accuracy of class diagrams by providing a snapshot of the system’s state.
4. Component Diagram
Component diagrams portray the organization of the physical components within the system. They are used for modeling execution details and determining whether the desired functional requirements have been considered in the planned development. Component diagrams depict the structural relationships between the elements of a software system.
5. Deployment Diagram
Deployment diagrams present the system’s software and its hardware, detailing what physical components exist and what software components are running on them. They provide information about system software and are incorporated whenever software is used, distributed, or deployed across multiple machines with dissimilar configurations.
6. Package Diagram
Package diagrams illustrate how packages and their elements are organized. They show the dependencies between distinct packages, managing UML diagrams by making them easily understandable. Package diagrams are used for organizing class and use case diagrams, providing a clear view of the system’s structure.
Behavioral Diagrams
Behavioral diagrams portray a dynamic view of a system, describing its functioning. They define the interactions within the system and include use case diagrams, state diagrams, and activity diagrams.
1. State Machine Diagram
State machine diagrams, also known as state-charts diagrams, portray the system’s behavior utilizing finite state transitions. They model the dynamic behavior of a class in response to external stimuli, providing a clear view of how the system transitions between different states.
2. Activity Diagram
Activity diagrams model the flow of control from one activity to another. They can model sequential and concurrent activities, visually depicting the workflow and what causes an event to occur. Activity diagrams are essential for understanding the system’s dynamic behavior.
3. Use Case Diagram
Use case diagrams represent the functionality of a system by utilizing actors and use cases. They encapsulate the functional requirements of a system and their association with actors, providing a use case view of the system. Use case diagrams are crucial for understanding the system’s requirements and interactions with users.
Interaction Diagrams
Interaction diagrams are a subclass of behavioral diagrams that emphasize object interactions and depict the flow between various use case elements of a system. They show how objects interact with each other and how data flows within them.
1. Sequence Diagram
Sequence diagrams show the interactions between objects in terms of messages exchanged over time. They delineate the order and manner in which object functions occur in a system, providing a clear view of the system’s dynamic behavior.
2. Communication Diagram
Communication diagrams show the interchange of sequence messages between objects. They focus on objects and their relations, describing both the static and dynamic behavior of a system. Communication diagrams are essential for understanding how objects communicate with each other.
3. Timing Diagram
Timing diagrams are a special kind of sequence diagram used to depict an object’s behavior over a specific period. They govern the change in state and object behavior by showing time and duration constraints, providing a detailed view of the system’s temporal behavior.
4. Interaction Overview Diagram
Interaction overview diagrams are a mixture of activity and sequence diagrams. They depict a sequence of actions to simplify complex interactions into simpler ones. Interaction overview diagrams are crucial for understanding the flow of control between different interactions in a system.
Conclusion
UML diagrams are indispensable tools in software engineering, providing a standardized way to visualize the design of a system. By categorizing diagrams into structural, behavioral, and interaction types, UML offers a comprehensive view of the system’s architecture and behavior. Whether you are documenting the static structure of a system, modeling its dynamic behavior, or understanding object interactions, UML diagrams provide the necessary insights to ensure successful software development.


