Fault Tree Diagram Tutorial

Fault Tree Diagram Tutorial

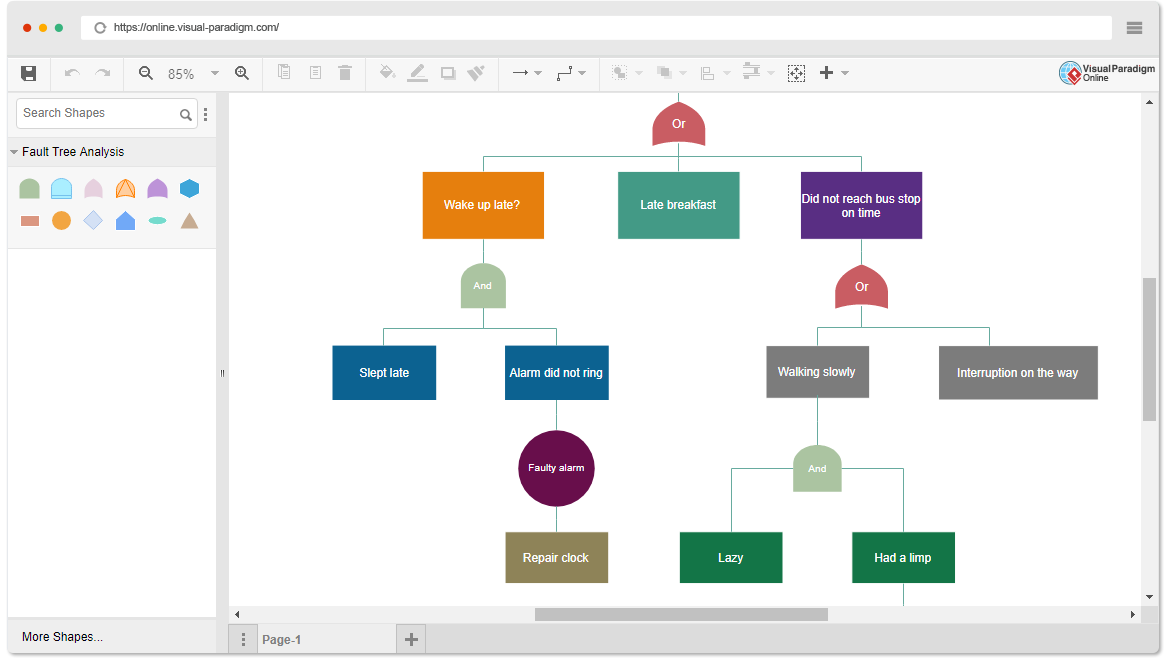
Fault tree analysis (FTA) is a top-down deductive fault analysis in which Boolean logic is used in conjunction with a series of low-level events to analyze the unexpected states of the system. This analysis method is primarily used in safety engineering and reliability engineering to understand how systems fail, determine the best way to reduce risk, and determine (or feel) the event rate of safety incidents or specific system-level (functional) failures.

Continue reading
What is Value Stream Mapping?

What is Value Stream Mapping?

Value stream mapping is a technique to identify and eliminate process waste. It is a special type of flow chart that uses symbols called “lean language” to describe and improve inventory and information flow. It helps us provide customers with the best value through a complete value creation process and minimize waste

Continue reading
PERT Chart Tutorial

PERT Chart Tutorial

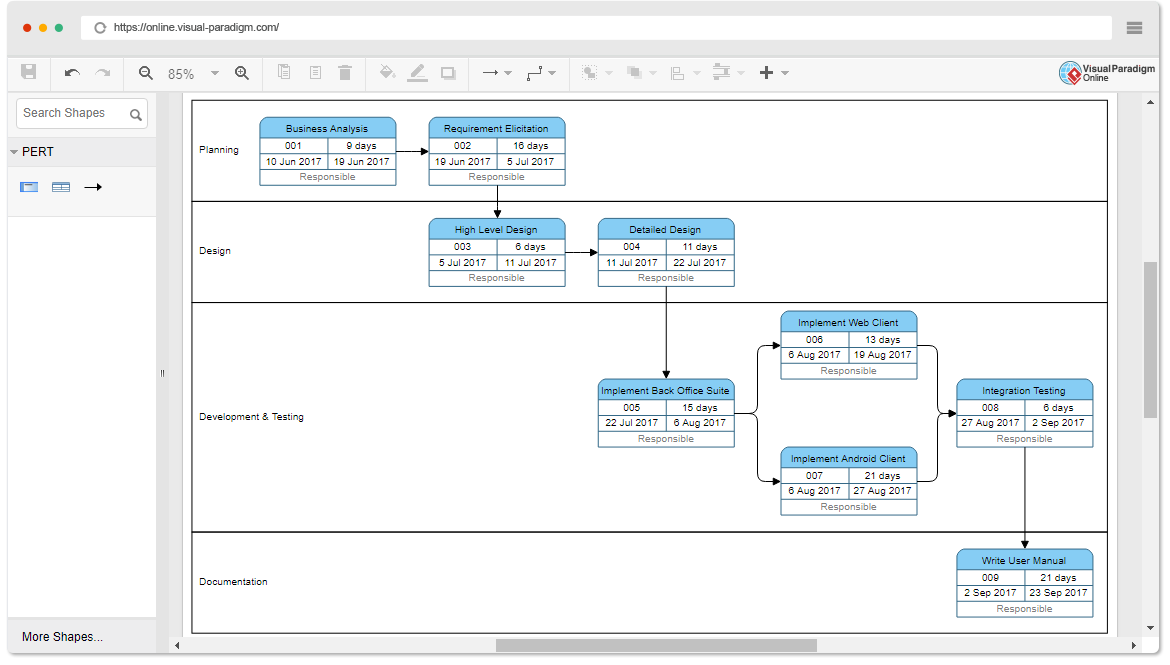
PERT Chart is acronym for (Program Evaluation and Review Technique). A PERT chart is a project management tool used to schedule, organize, and coordinate tasks within a project. It is basically a method to analyze the tasks involved in completing a given project, especially the time needed to complete each task, and to identify the minimum time needed to complete the total project.

Continue reading
What is a Sprint in Scrum?

What is a Sprint in Scrum?

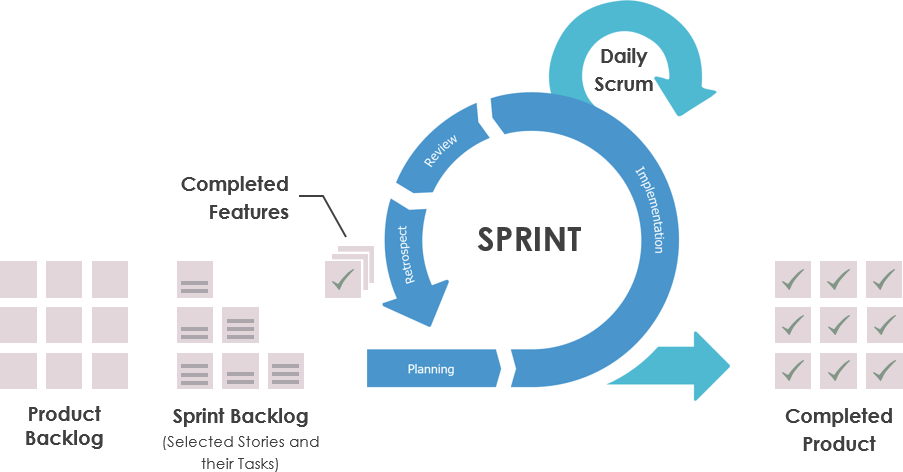
Sprint is one timeboxed iteration of a continuous development cycle. Within a Sprint, planned amount of work has to be completed by the team and made ready for review. Scrum projects are broken down into small and consistent time intervals referred to as sprints. They can be as short as a few days and generally are no longer than 3–4 weeks.

Continue reading