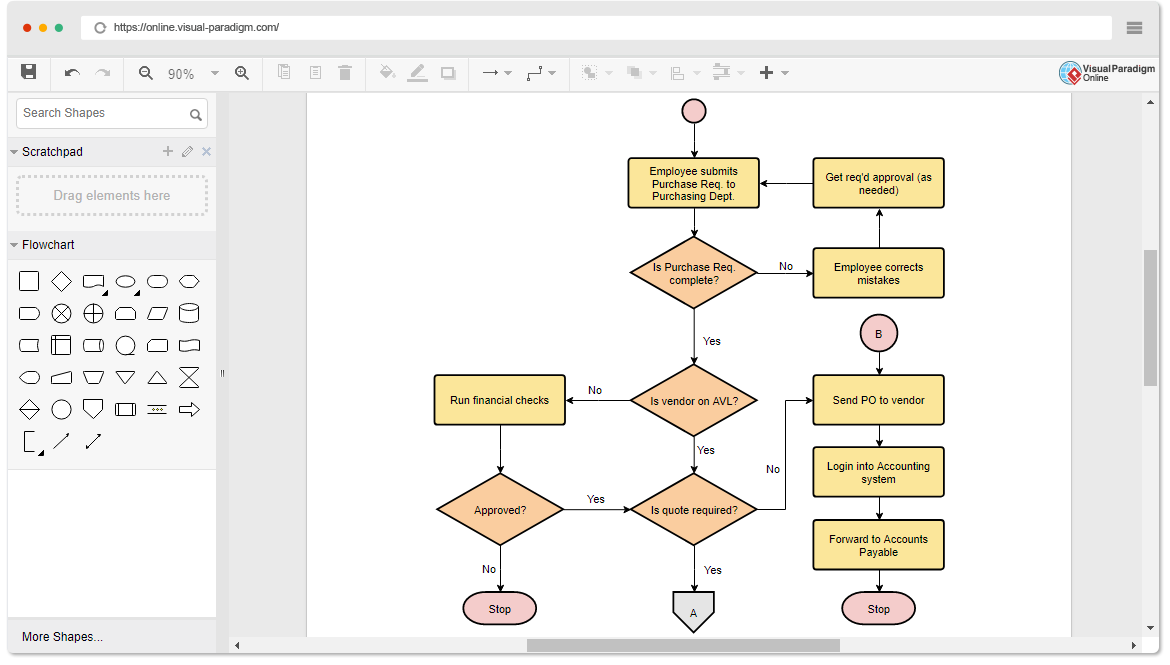
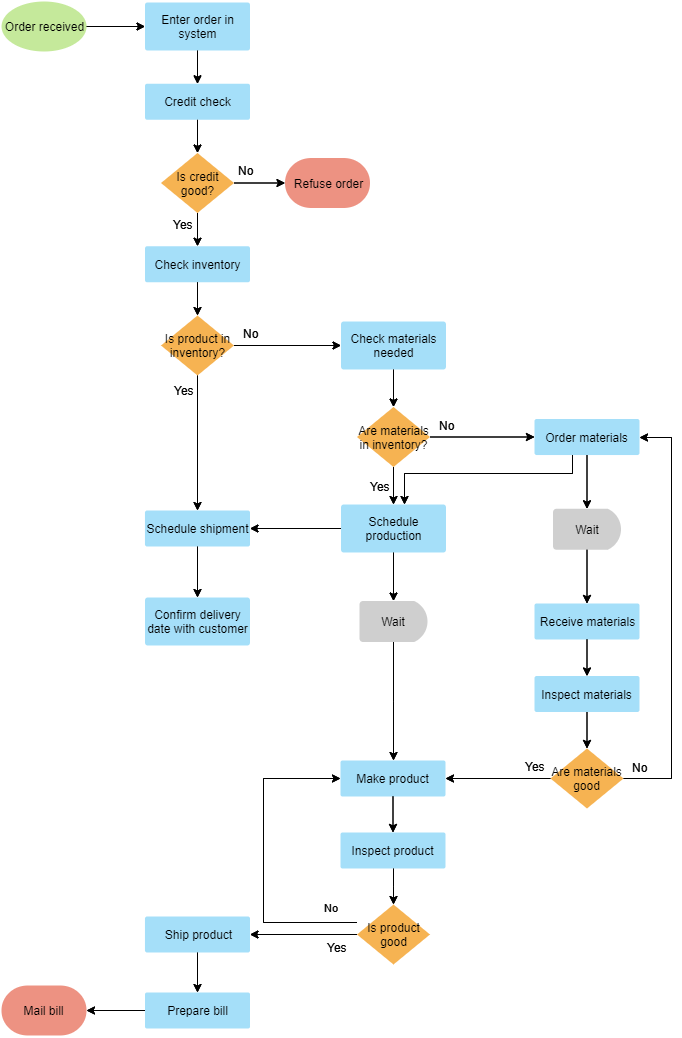
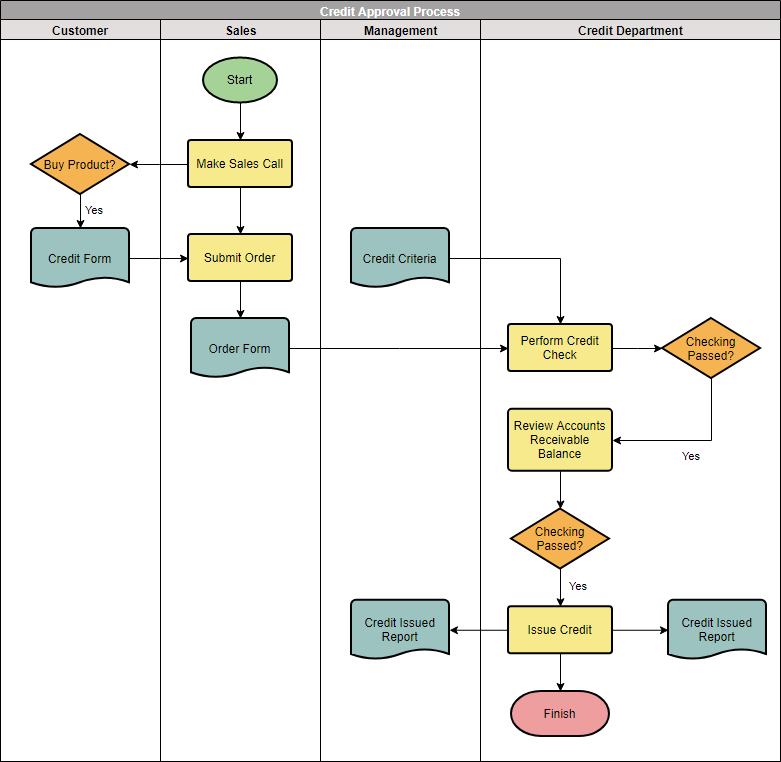
While the basic flowchart clearly illustrates the entire process, it does not clearly show which role is responsible for each step of the process. In order to effectively represent who is responsible for each process, it can be realized by swimlane flowchart, which not only reflects the whole activity control flow, but also clearly knows the responsibility that each role takes in the process.
Continue readingDanh mục: Brainstorming
Super Simple Flowchart Guide
A flowchart is a graphical representation of the operations involved in a data processing system. operations in the system. Often, the best way to understand a problem is to draw a diagram. Diagrams usually give us a more complete picture of a situation than a short set of words or phrases. However, the combination of visual symbols )(shapes) and text provides a very powerful tool for communication and problem solving. Algorithms can be developed more quickly when a flowchart is created to represent them. Flowcharts are much easier to understand than algorithms.
Continue readingFlowchart – A Quick Guide
A flowchart is a graphical representation of an algorithm, workflow, or process, with different types of boxes representing different types of steps, and arrows connecting every two steps. This representation facilitates the illustration of solutions to known problems. Flowcharts are widely used to analyze, design, document, and operate processes or procedures in many fields.
Continue readingA Comprehensive Guide to Flowchart
A flowchart is used to show the successive steps in a process. Such diagrams use a series of interrelated symbols to map the entire process, making the process easy to understand and helpful in communicating with others. Flowcharts can be used to explain the workings of a complex and/or abstract process, system, concept or algorithm. Flowcharting can also help to plan and develop processes, or improve existing processes.
Continue readingSWOT Analysis: Coca-Cola
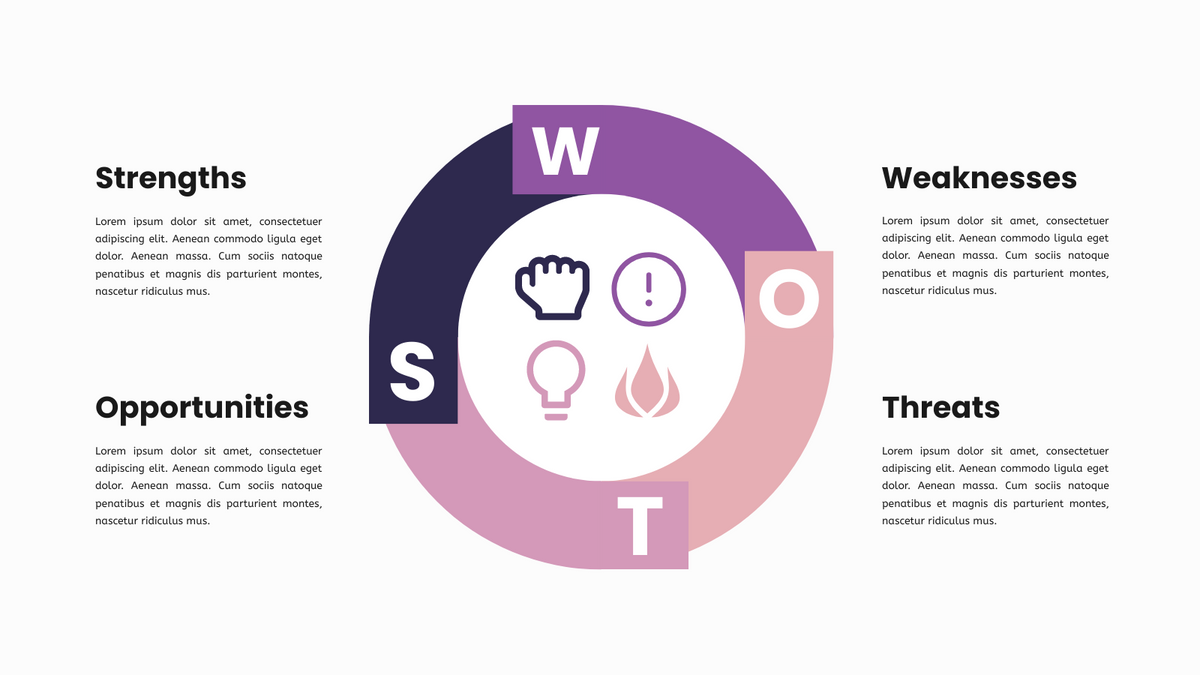
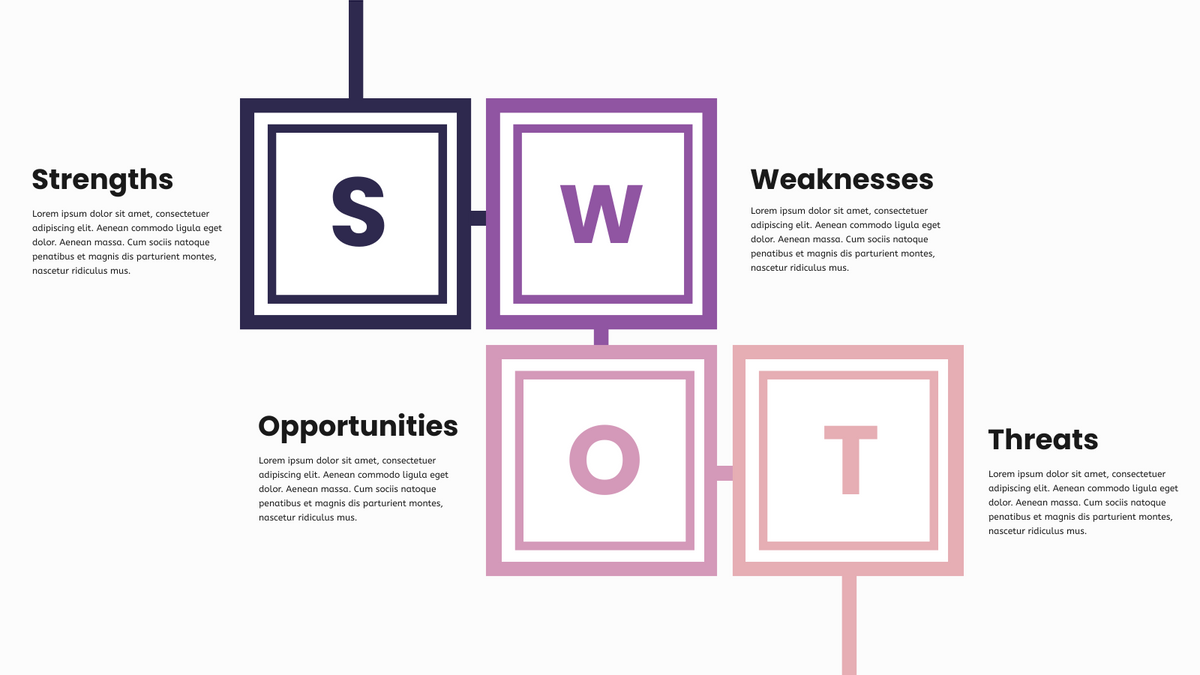
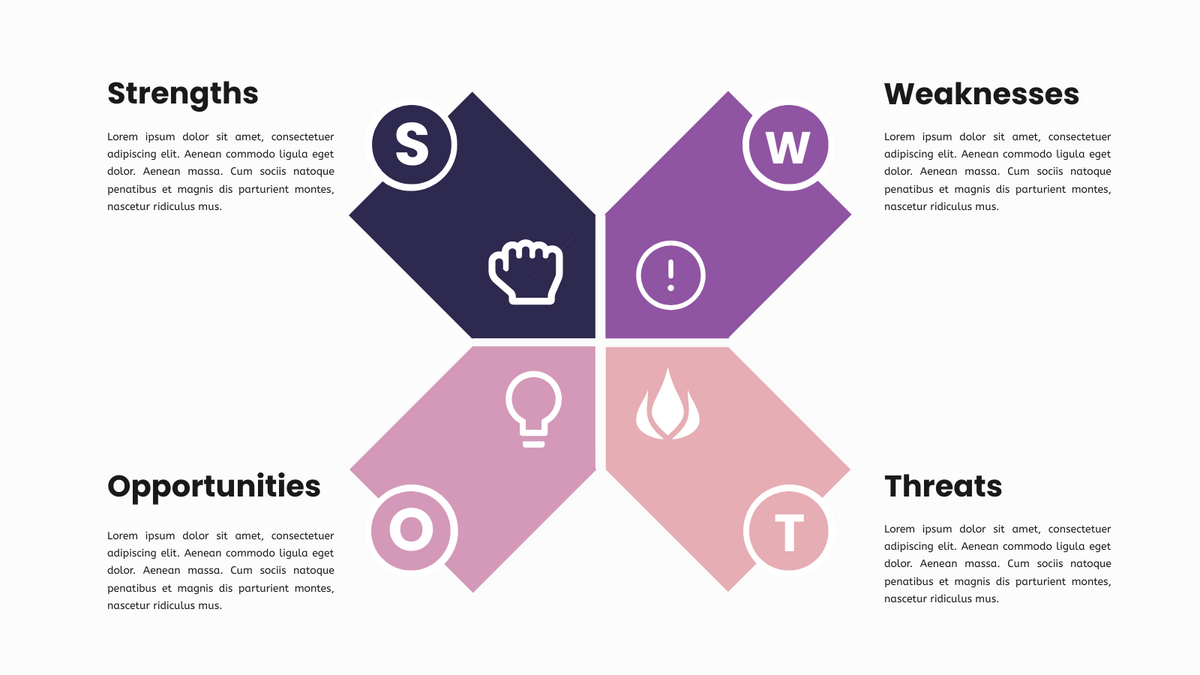
SWOT analysis is the most common market analysis method used in business and academia to evaluate the internal strengths and weaknesses of a company as well as the opportunities and threats of external competitors through brainstorming. SWOT analysis represents Strength, Weakness, Opportunity and Threat. This analysis framework helps companies to assess their competitive position and formulate strategic plans.
Continue readingQuick Guide to SWOT Analysis
What is the SWOT analysis method? The SWOT anlysis is a situational analysis method based on the analysis of internal
Continue readingWhat is SWOT analysis? Take Nike’s SWOT analysis as an example
What is SWOT Analysis? SWOT consists of four aspects, starting with the first character of the word: ” Strengths”, “Weaknesses”,
Continue readingHow to use SWOT analysis?
What is SWOT Analysis? SWOT Analysis (also known as strengths, weaknesses, opportunities and threats analysis) is the easiest way to
Continue readingSwiss Knife: Your visual competitive analysis toolbox
Strategic analysis is the core step of the strategic planning cycle. Every strategist should have a set of analytical model tools to deal with. However, there are many techniques and tools available for strategic analysis. If you search Google on the Internet, you will find many options available.
Continue readingSimple Thinking Tools: T charts and Y charts
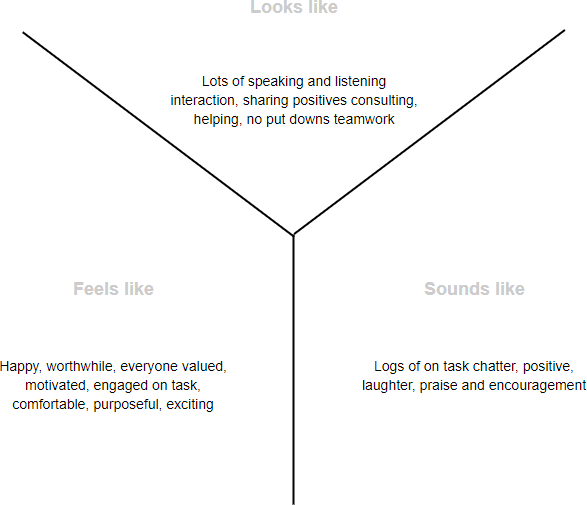
Both T-charts and Y-charts help to graphically organize and record ideas, feelings and information, while identifying and focusing on what teachers / students already know, understand, value and can do. It enables students / teachers / teachers to compare and contrast ideas, feelings and information in various context.
Continue reading