Các quy trình có thể được biểu diễn bằng sơ đồ luồng, nhưng chúng có một nhược điểm – sơ đồ luồng tiêu chuẩn không thể chỉ ra ai là người chịu trách nhiệm cho các hoạt động này.
Sơ đồ luồng chức năng chéo cho thấy ai đã làm gì và khi nào trong các sơ đồ bơi hoặc lưới. Những sơ đồ này được tổ chức thành nhiều phần để cung cấp thêm các chiều bằng cách gán mỗi bước quy trình vào một danh mục. Nói cách khác, bạn có thể sử dụng sơ đồ luồng chức năng chéo để mô tả mối quan hệ giữa các bước trong quy trình và bộ phận hoặc lĩnh vực chức năng chịu trách nhiệm cho các bước đó.
Ví dụ, một danh mục có thể là một bên liên quan (cá nhân, vai trò hoặc bộ phận), nhưng nó cũng có thể là một máy móc, giai đoạn dự án, tài nguyên hoặc thuộc tính khác.
Tại sao lại là Sơ đồ quy trình chéo chức năng?
Như đã đề cập trước đó, một quy trình kinh doanh gần như luôn liên quan đến các bộ phận, đơn vị hoạt động hoặc bên liên quan trong mọi doanh nghiệp. Loại hình trực quan hóa và quản lý quy trình này trở nên khó khăn hơn khi các quy trình liên quan đến nhiều bên liên quan hoặc trải dài qua nhiều giai đoạn với đầu vào từ các nhóm khác nhau. Thường cần có những nỗ lực đáng kể để hiểu các quy trình này thông qua trực quan hóa và sau đó phát triển chúng theo cách mà chúng có thể trở nên mượt mà và hiệu quả hơn. Trong những tình huống như vậy, sơ đồ luồng truyền thống không đủ khi nói đến việc trực quan hóa các phụ thuộc chức năng chéo như vậy.
Sơ đồ luồng chức năng chéo mang lại sự rõ ràng cho các quy trình bằng cách xác định ai làm gì. Mỗi làn bơi đại diện cho một người, nhóm hoặc bên liên quan, làm cho rõ ràng ai là người chịu trách nhiệm cho giai đoạn nào trong quy trình để giúp tránh nhầm lẫn.
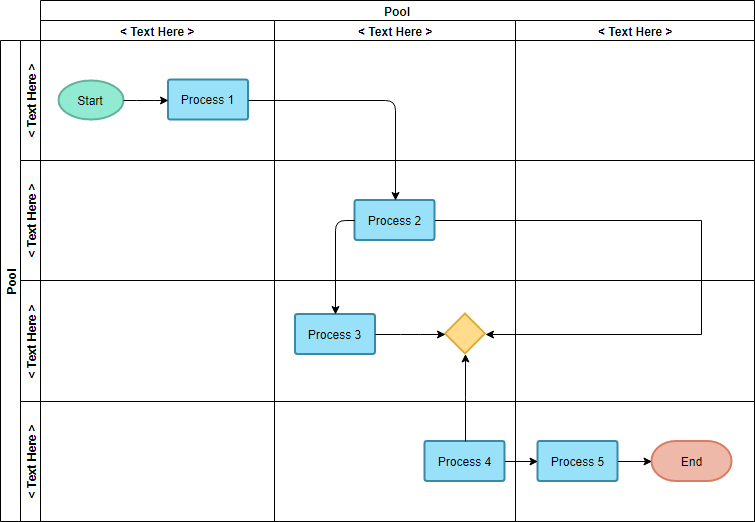
Mẫu Sơ đồ quy trình chéo (Làn bơi dọc)
Đây là một sơ đồ làn bơi đơn giản, chia nhiều quy trình thành ba nhóm dọc và bốn nhóm ngang. Sử dụng mẫu này làm điểm khởi đầu để tạo ra một sơ đồ làn bơi. Tùy chỉnh sơ đồ cho giải pháp của bạn. Không cần đăng ký trước.
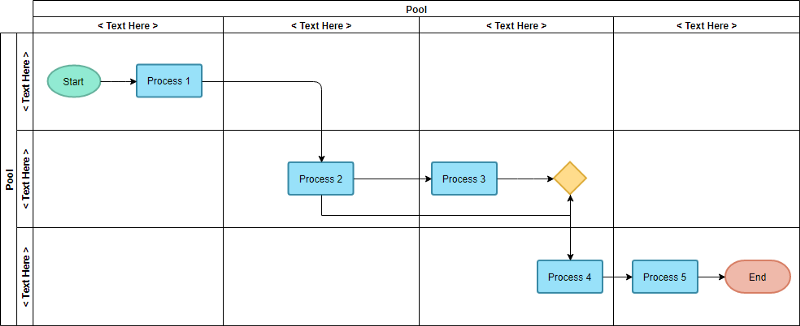
Mẫu Sơ đồ quy trình chéo (Kiểu lưới)
Đây là một sơ đồ làn bơi đơn giản, chia nhiều quy trình thành bốn nhóm dọc và ba nhóm ngang. Mẫu sơ đồ làn bơi này giúp bạn tạo ra các quy trình trong tổ chức của bạn.
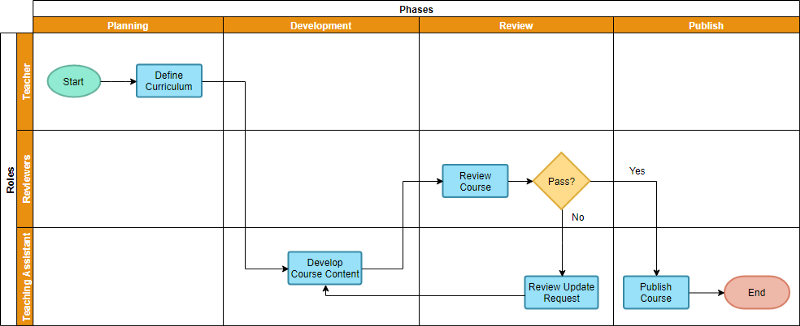
Ví dụ Sơ đồ quy trình chéo (Kiểu lưới) – Phát triển khóa học
Đây là một ví dụ về sơ đồ làn bơi cho thấy toàn bộ quy trình phát triển khóa học. Quy trình được chia thành 4 giai đoạn – Lập kế hoạch, Phát triển, Đánh giá và Xuất bản. Giáo viên, người đánh giá và trợ giảng làm việc cùng nhau để sản xuất một khóa học.
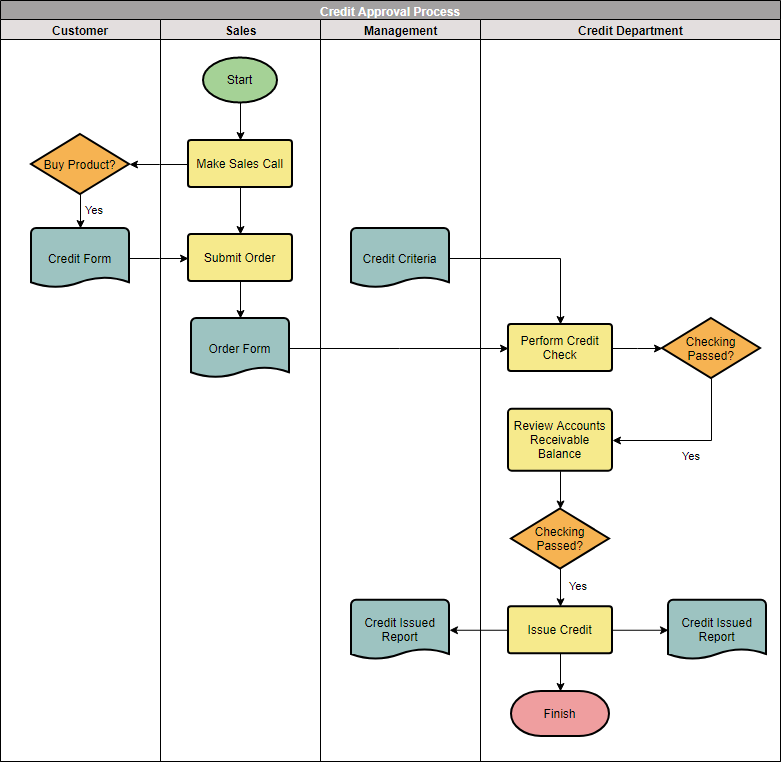
Ví dụ Sơ đồ quy trình chéo – Quy trình trả lương
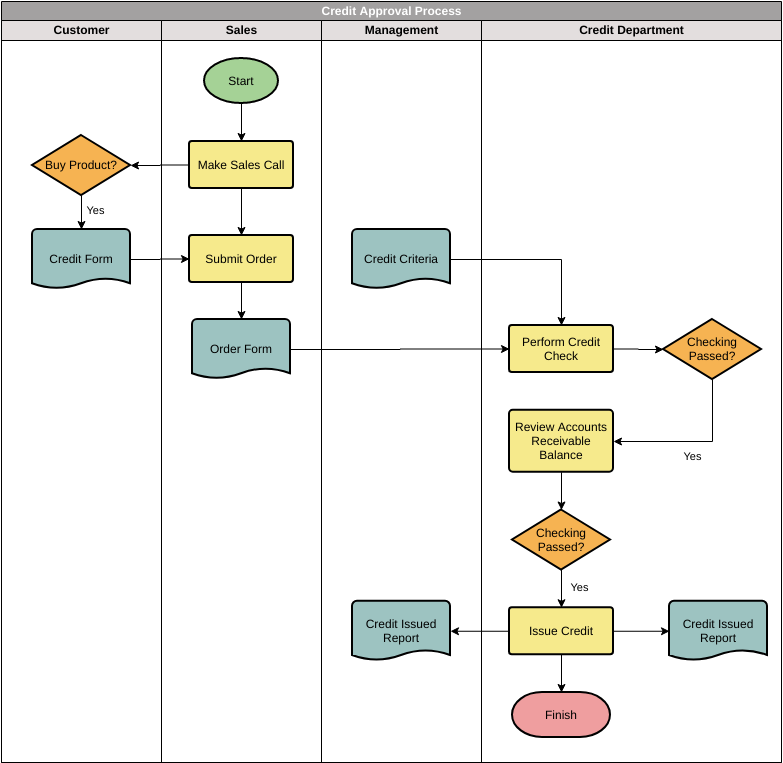
Sơ đồ luồng đơn đặt hàng cho thấy quy trình phê duyệt tín dụng của đơn đặt hàng (PO). Quy trình bắt đầu từ việc tạo mẫu đơn và trải qua quy trình phê duyệt tín dụng và phê duyệt của ba bộ phận khác nhau (Bộ phận Bán hàng, bộ phận tín dụng và bộ phận quản lý):
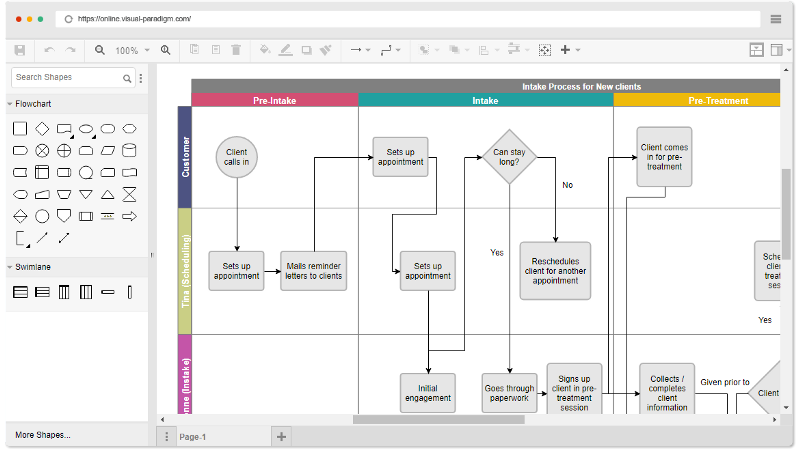
Công cụ Sơ đồ quy trình chéo trực tuyến
Vẽ Sơ đồ quy trình chéo trực tuyến, với công cụ Sơ đồ quy trình chéo trực tuyến dễ sử dụng
Mẫu Sơ đồ luồng triển khai
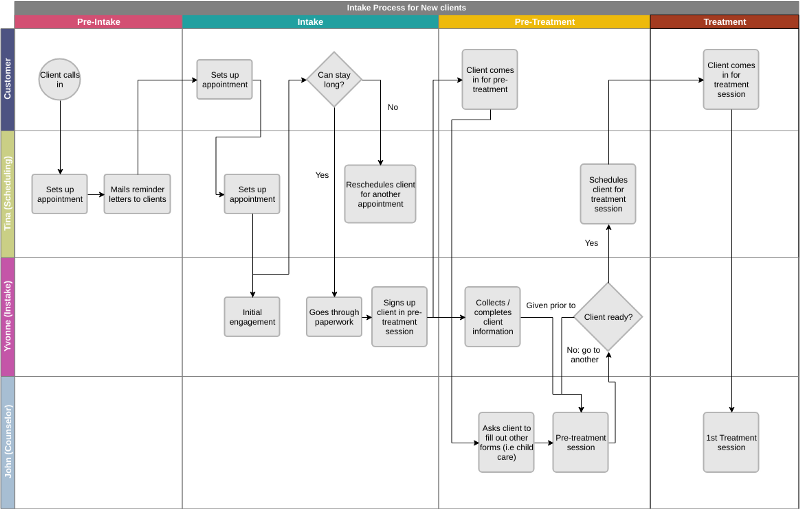
Sơ đồ quy trình tiếp nhận khách hàng chức năng chéo
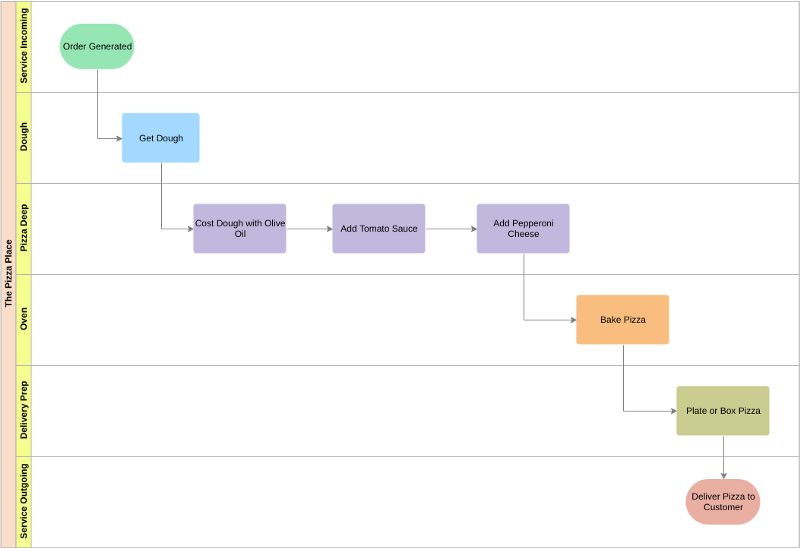
Sơ đồ quy trình chức năng chéo của quán pizza
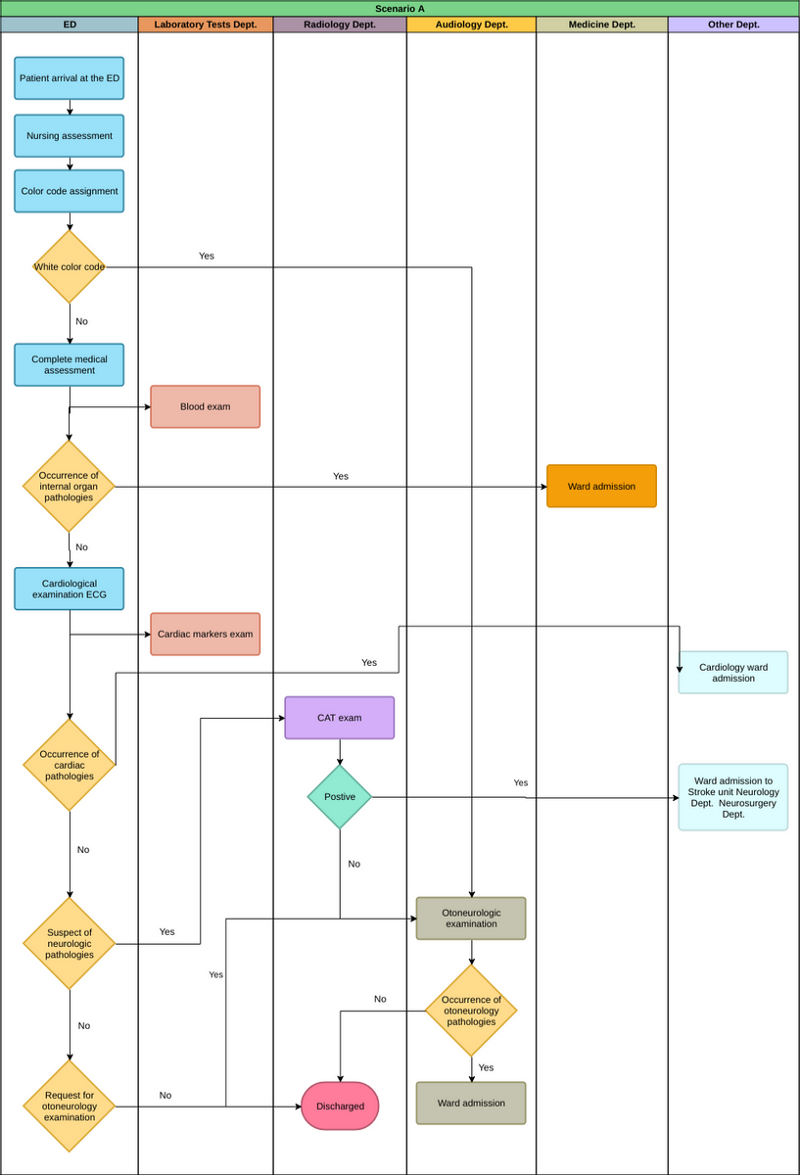
Sơ đồ quy trình chức năng chéo của bệnh viện
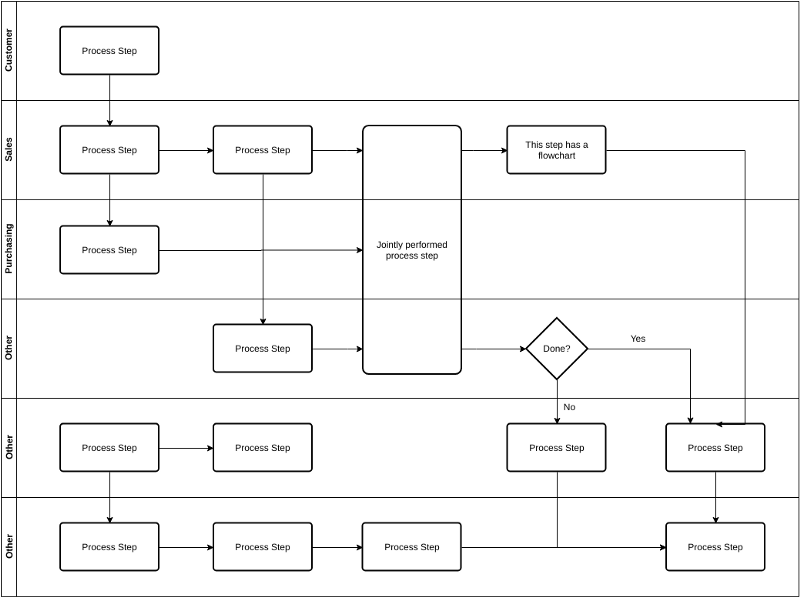
Mẫu Sơ đồ quy trình chức năng chéo cho khách hàng
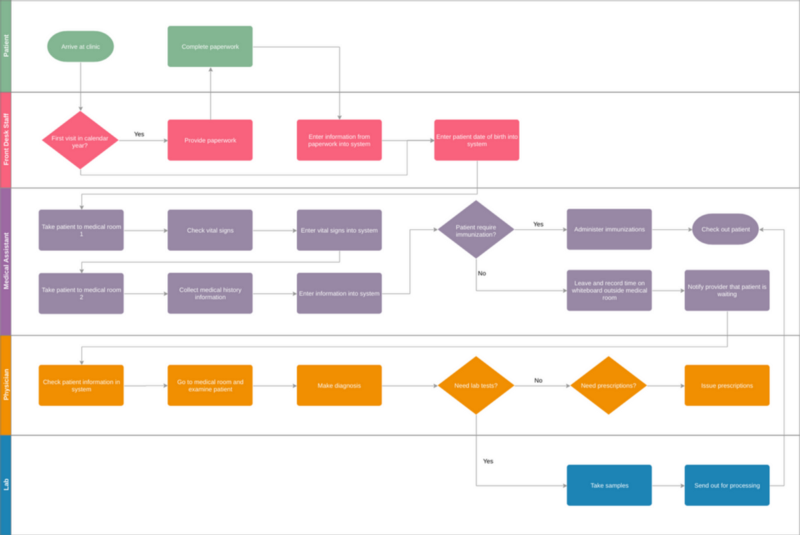
Sơ đồ quy trình chức năng chéo của phòng y tế
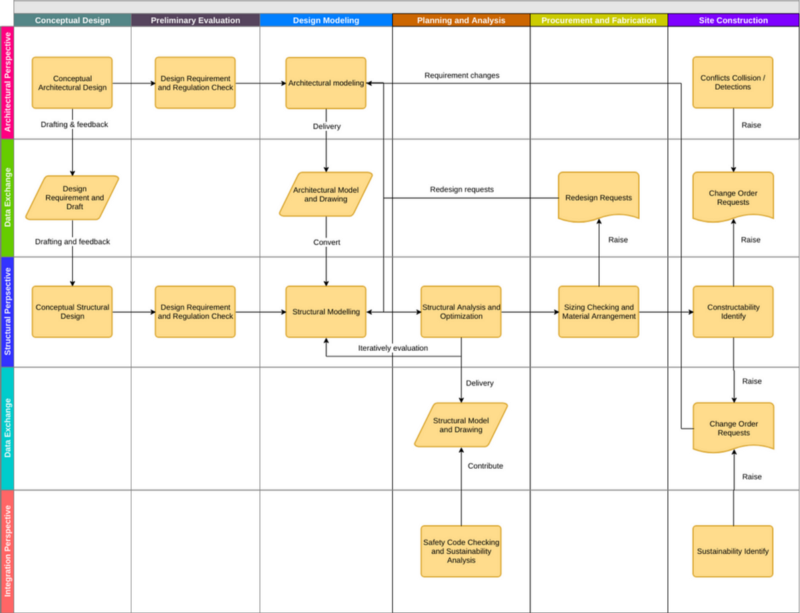
Sơ đồ quy trình chức năng chéo thiết kế xây dựng
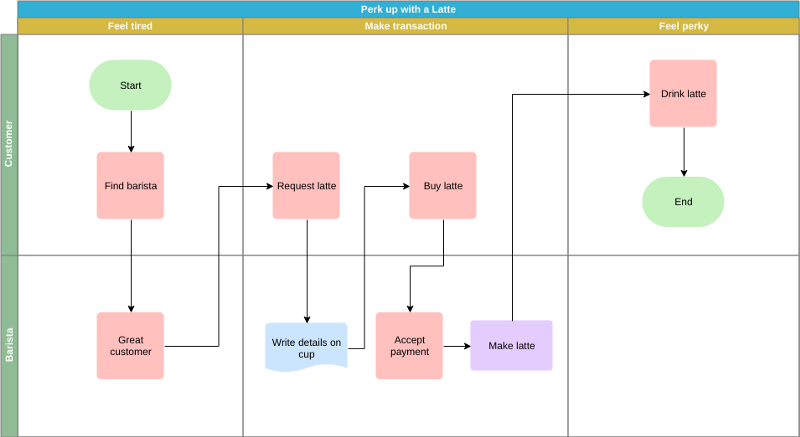
Sơ đồ quy trình chức năng chéo giao dịch
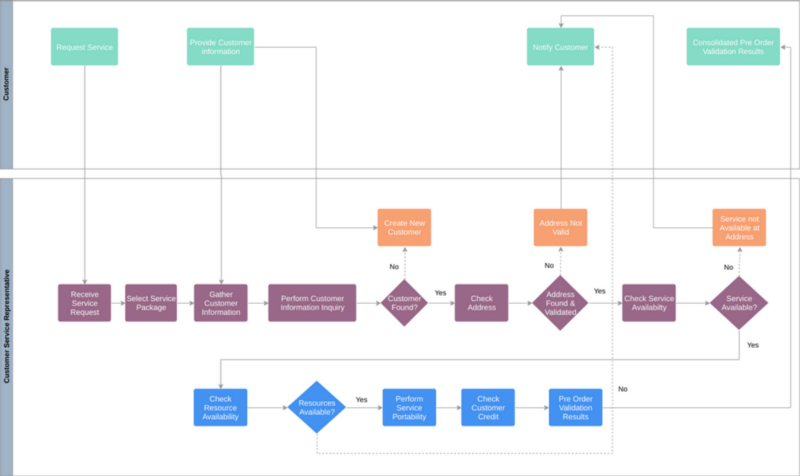
Sơ đồ quy trình chức năng chéo khách hàng
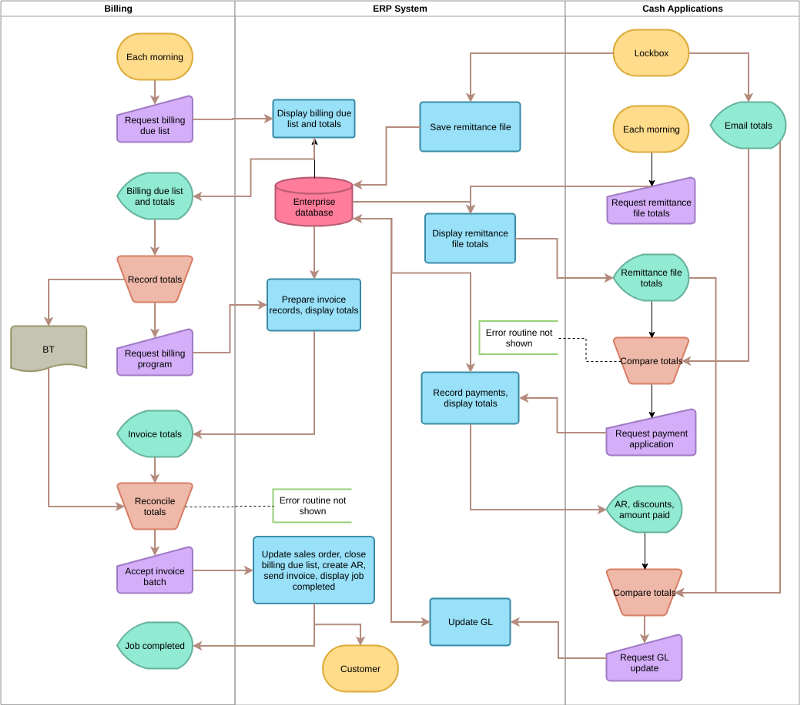
Sơ đồ quy trình chức năng chéo thanh toán
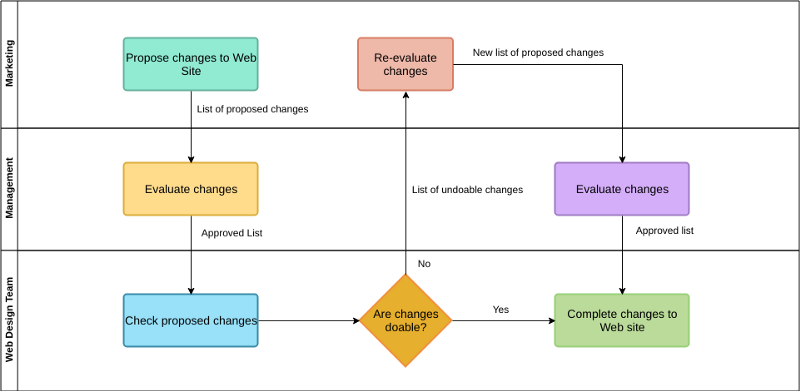
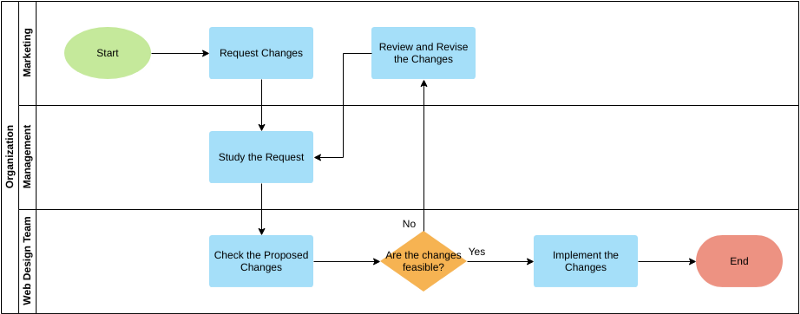
Sơ đồ thay đổi trang web chức năng chéo
This post is also available in Deutsch, English, Español, فارسی, Français, Bahasa Indonesia, 日本語, Polski, Portuguese, Ру́сский, 简体中文 and 繁體中文.


