Venn Diagram: A Comprehensive Tutorial

Sơ đồ Venn: Hướng dẫn toàn diện

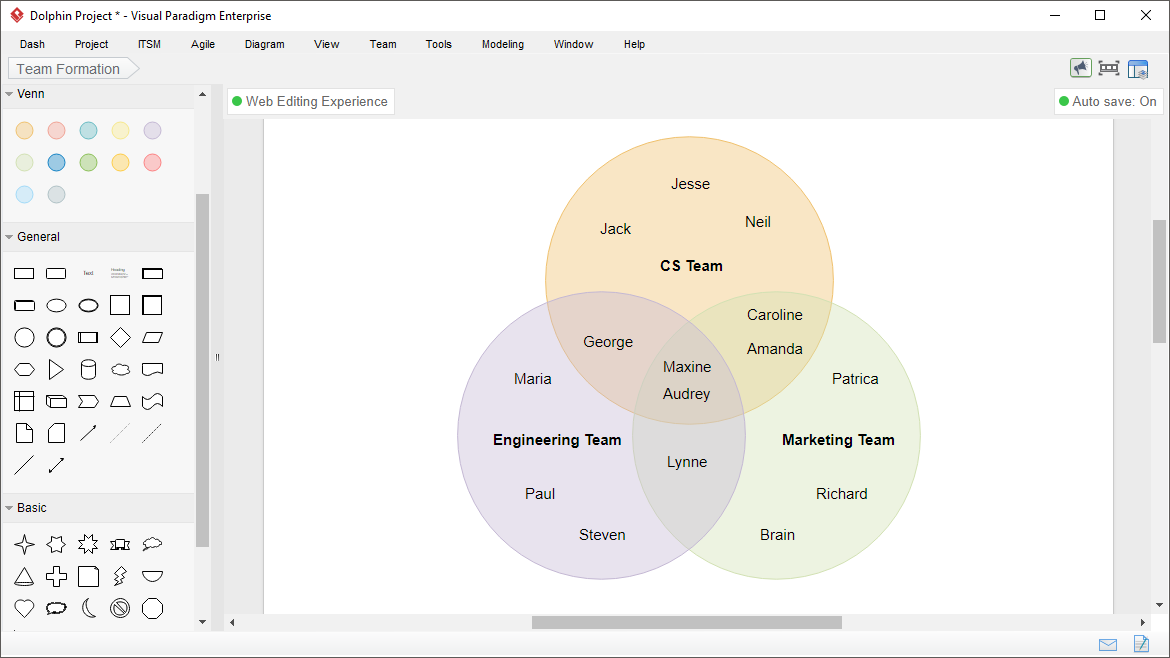
Venn diagrams are graphical or pictorial representations of relationships between different groups of things. Venn Diagram was invented by John Venn around 1880. Venn diagrams are also called set diagrams. Venn diagrams give a logical representation of the groups or sets. Relationships between two or three sets can be easily understood with the help of Venn diagrams. In mathematics, Venn diagrams are used to analyze known information obtained from surveys, data reports, and tables.

Continue reading
Strategic Planning to Actionable Items: From SWOT to TOWS Analysis

Lập kế hoạch chiến lược thành các mục hành động: Từ phân tích SWOT đến TOWS

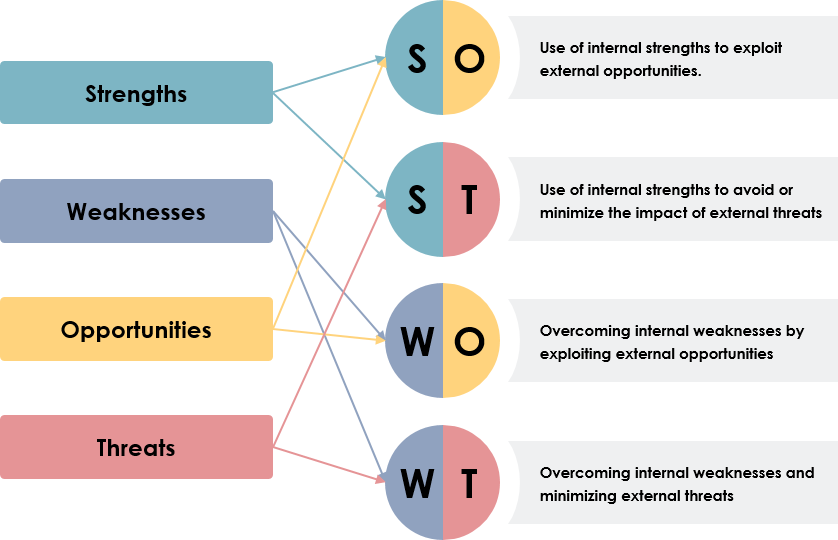
SWOT matrix is a planning tool, whereas TOWS matrix is an action tool. In SWOT analysis you identify all the Strengths, Weaknesses, Opportunities, and Threats in point form. After that you think of each point as a singular perspective. Whereas, TOWS matrix identifies the relationships between these factors and selecting strategies on their bases. Strengths and weaknesses are abstract concepts that can be hard to think about without any sort of context.

Continue reading
A Comprehensive Tutorial on SSADM

Hướng dẫn toàn diện về SSADM

Structured Systems Analysis and Design Method (SSADM) structural systems analysis and design methods, standards set in the early 1980s development, is widely used in the design and application of the calculation. It uses a combination of text and diagrams for system design throughout the life cycle, from the initial design concept to the application of actual physical design.

Continue reading