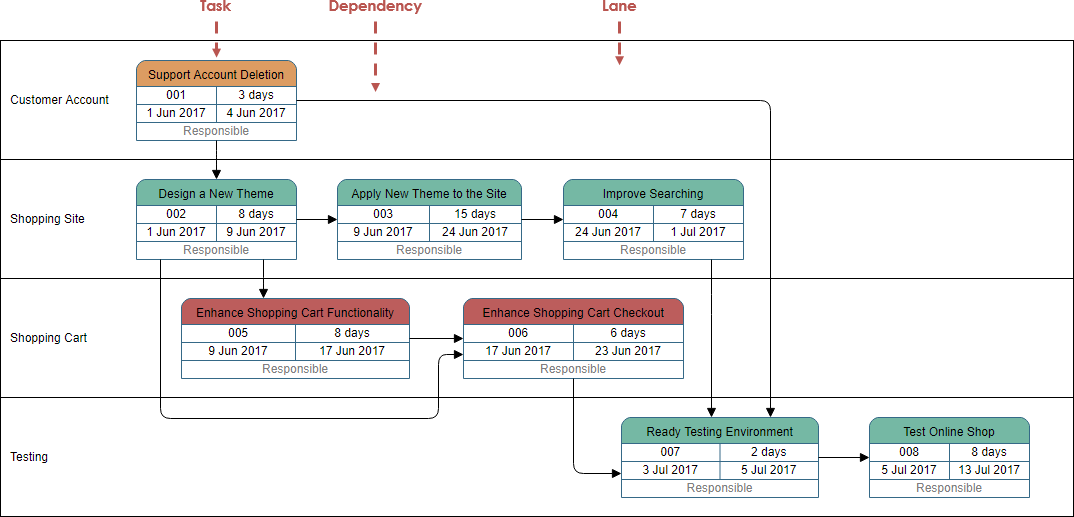
PERT diagrams show each task in a project as a node. Dependencies between tasks (for example, one task needs to be completed before another can be started) can be clearly shown through connections between task nodes. It also shows time information for each task, similar to the critical path approach (CPM), which determines the longest path for a project and thus the minimum time for the project to complete.
Continue reading